Built for People Who Take Action
-
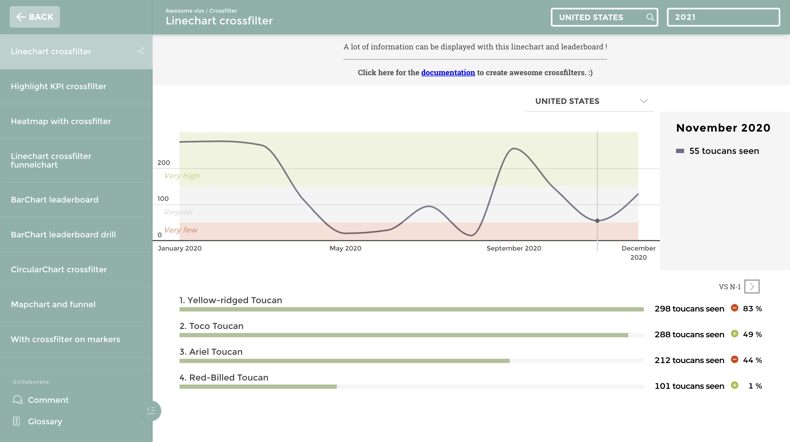
Add the “so what?” story to your charts. No more wondering if a trend is good or bad, if actions have been taken or not.
-
Add tips and glossaries so viewers always know how to interpret what they’re seeing and don’t leave confused
-
Annotate charts — draw right on them, add comments and suggestions — and send to your team via Slack, MS Teams, or email in a few clicks.
- Keep a running dialog of root causes, ideas, and actions right alongside the charts (where it belongs)
3x adoption vs the industry average
-
Companies that use Toucan use the platform 3x more than other tools
-
Easy to deploy — get Toucan up-and-running in a few days and make changes in seconds so there’s no “IT wait time"
-
Easy to create dashboards — build new data stories with charts, narrative, and sequencing in minutes without expert support
- Easy to understand — narrative, tips, and glossaries take dashboards beyond “pretty pictures” and ensure engagement
Everywhere You Need Us
-
Access dashboard from any browser — nothing to download, no special requirements
-
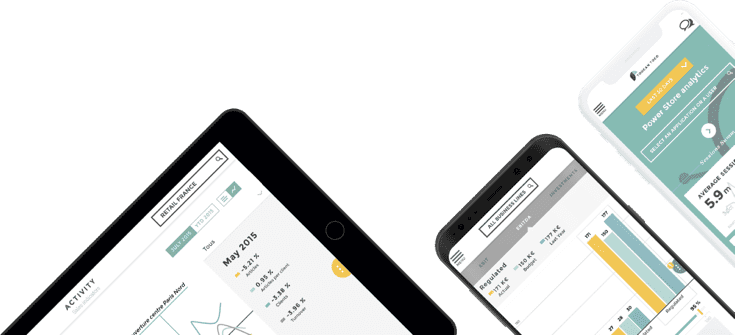
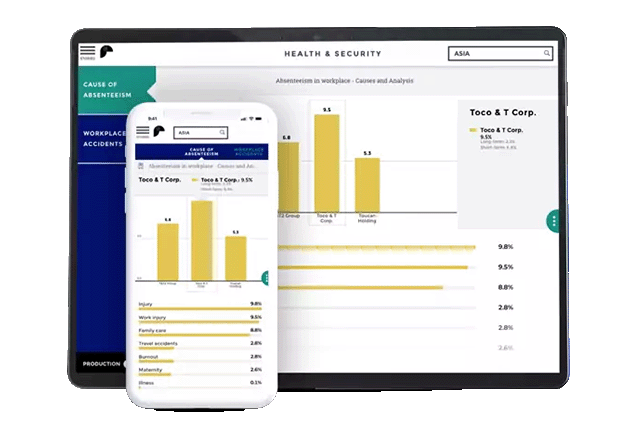
Instant mobile — build a Toucan chart or dashboard and it’s immediately accessible on any mobile device (including buttons built for human-sized fingers and text you can actually see)
-
Embed into any app — complete with management tools & automation — so your customers and partners can have analytics, too.
- Send professional-grade PDF reports as easy as "click, select, & send"

Explore Toucan on your own
Discover all the charts variations, data storytelling features and more!
Customer Stories


"Unbelievably impressed with how much Toucan allows us to modify. We have the ability to do anything we need to. It feels like an integrated component of our CSS."


"We rolled-out our first dashboard in less than 2 weeks and increased our sales closure rate by 10%"


"Toucan has cornered the market on customer service and without them, we wouldn't be where we are today."


"By narrating our insights, Toucan has helped the government reinforce the trust of our Citizens in the action of the States."


"We're saving 2500 hours of data consolidation per year & 700 store managers now have access to daily insights thanks to Toucan."


"We gained +0.8 in customer satisfaction thanks to clearer operations, leading to better management."
Ready to get started? Experience data stories


