With uncertainty and elevated risk in the current housing market, real estate professionals are turning to more precise and exact data reporting tools to drive successful investment decisions. Many of these metrics have long been reported quarterly, with traditional BI tools serving a minimal purpose to generate reporting. Data visualization’s rise has completely changed that. Now that data visualization technology has finally caught up with its use cases in real estate, professionals can track these KPIs instantly through cloud-developed applications.
We’re not the only ones to arrive at this conclusion, many evolving real estate firms have reported the following benefits of implementing data visualization:
- It makes you smarter (constantly and accurately informs decisions)
- Higher consistency
- Scalability
- Easier comparability and predictability

These aspects of data visualization tools apply to every aspect of real estate, where data analytics dashboards must be exact, accessible, and versatile. With the modern leaps in BI tools, professionals can track more KPIs than ever before, increasing the output of insights.
Top 5 KPIs we think are crucial to a well-functioning real estate dashboard
1. Payback Period
For real estate investors, the payback period is crucial to understanding whether an investment will be profitable in a realistic time, indicating the number of years a property will return its initial investment. This metric can be calculated by using the formula:
- Payback Period = Initial Capital Cost for Project / Annual Savings or Earning from Project
2. Return on Investment (ROI)
Just as with any other investment, real estate investors calculate ROI to inform their investing decisions. If one set of properties is returning a low rate on an investment, investors can modify their portfolio to include more assets that are performing well. To calculate ROI utilize this formula:
- ROI = (Net Profit / Total Investment) * 100%
3. Tenant Turnover
For investors owning multiple properties tenant turnover is crucial to assessing the rate at which tenants are leaving. The properties with low turnover are more desirable since they generate consistent income, while properties with high turnover cause gaps in tenant revenue. The formula to calculate tenant turnover is:
- Turnover Rate = (# of Tenants Moved Out / Total # of Tenants) * 100%
4. Average Commission per Sale
This KPI tracks the performance of real estate agents, measuring the amount of commission generated per sale. For a successful firm, this KPI should increase over time:
- Average Commission Per Sale = Total Commission Value / # of Sales
5. Construction Cost Per Square Foot
For real estate developers, this KPI is important for client transparency as well as expense management. It measures the expenses per square foot for budgeting and price setting. To calculate this KPI utilize the formula:
- Construction Cost Per Square Foot = Total Construction Cost / Total Area
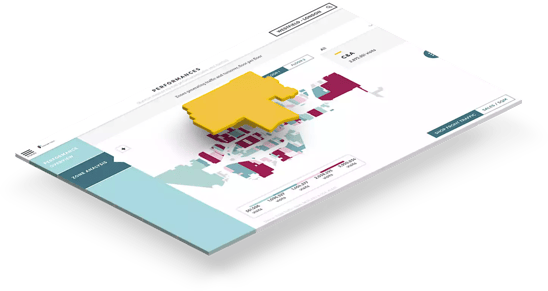
Although KPIs are crucial to an effective and efficient dashboard, real estate dashboards must have a simple and sleek design. Data visualization tools like Toucan allow dashboard builders to integrate maps, tenant demographics, disposable income, and consumer behavior, allowing investors to analyze the effectiveness of a possible investment.

By adding these important visualizations to a real estate dashboard, DataViz tools such as Toucan help tell a data story, including the characters, setting, plot, conflicts, and resolution. There are aspects of real estate dashboards that drive real estate professionals away from data visualization, and all of these can be remedied with newer generation BI tools.
Common Mistakes to Avoid
- Lack of reporting periods
For real estate firms utilizing older BI tools operated by data teams, reporting of crucial KPIs occurs quarterly or even semi-annually, limiting the amount of insights decision-makers and employees can draw from. If the data remains consistent quarterly or shows weaknesses, executives may decide to abandon BI tools altogether, reasoning that their business operates with the same results with or without data analytics.
The lack of updating data also hinders the use cases for data visualization. When real estate professionals cannot extract insights to support decisions on a daily basis, such as tenant demographics, development ROI, and consumer behavior, older generation BI tools become useless in an ever-evolving data analytics landscape. With tools such as Toucan, real estate firms receive insights in real-time, resulting in a more involved team at all levels.
- Absence of Collaboration
For larger real estate firms, employees at every level of the hierarchical ladder contribute to the success of the firm. During a downturn or a weak period, every executive’s dream is to make their data accessible to employees performing poorly. With older BI tools, this feature is not a possibility, preventing data-driven collaboration with underperforming or overachieving employees at every level.
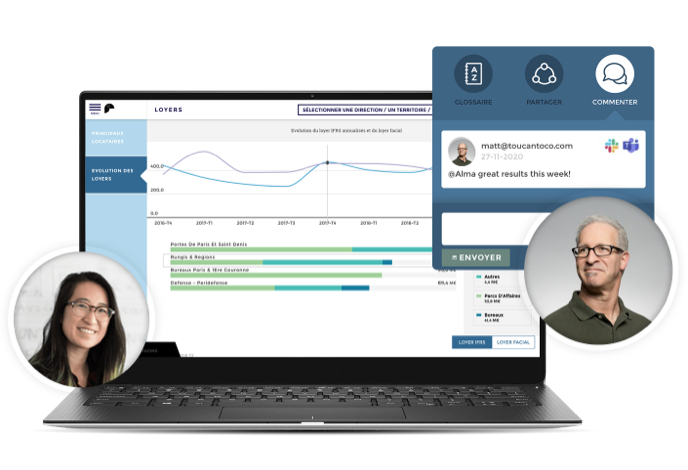
We are glad to say that Toucan has solved this problem by including cloud-powered collaboration tools. By embedding collaborative tools such as annotations, data sharing, and commenting, real estate executives can discuss the performance of any employee, at any time, and anywhere.
- Complexity and Unreliability
We have all heard about the miserable board meetings where IT teams try to fix a freezing PowerPoint slide while company decision-makers awkwardly whisper about why their higher-ups invest in an expensive and unreliable BI tool. With the newer generation, BI tools such as Toucan, say goodbye to glitchy and unreliable reporting. With the option to export insights to PDF and many other mediums, unreliability and wasted time is a thing of the past.
In the real estate industry, data reporting has never been more important to the success of a firm. With crucial KPIs, cloud-based data visualization, and collaboration can elevate an analytics software investment into a company’s most important asset. By investing into a newer reporting tool that arranges your data into a concise and relevant story. Learn more about how Toucan can help you build the dashboard that will elevate your real estate firm.


