Sessions per User - What is it?
Sessions per user is an important metric that counts the average number of sessions that each user engages in on your website or application. This KPI is an engagement metric that monitors user engagement with your website or product.
We'll dive into why sessions per user is crucial for every web-based company to track, how to calculate it, and the best solution to monitor it.
How to Calculate Sessions per User?
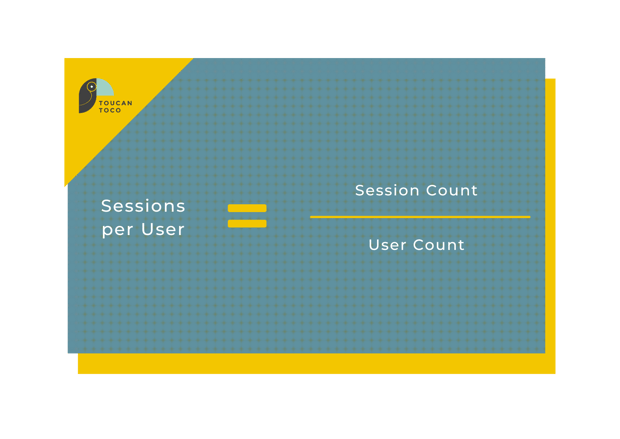
You can calculate sessions per user by using the following formula:

Here's an example calculation. Your website was accessed by 30,000 users in a month, which performed 60,000 sessions. By using the formula, you can deduce:
60000 sessions / 30000 users = 2 sessions per user
The average sessions per user benchmark is about 1.4 sessions per user, with the top websites reporting 1.6-1.9 sessions, according to a Littledata survey of over 6,000 websites. If your average sessions per user are under 1.4, consider investigating what is preventing users from interacting with your product.

Why are Sessions per User Important?
Calculating and monitoring sessions per user can be useful to gain insights into your website traffic and usage rates. Usually, a session is defined as a 30-minute period in which a user interacts with your product, with the end of the period signifying a new session.
Essentially, the higher your sessions per user, the more likely it is that you are retaining users. Tracking this KPI can help you understand how users interact with your site and gain insights on which users to target. audience.
How to Track Average Session Duration
Although many businesses leverage Google Analytics as their solution for tracking KPIs like sessions per user, it may not provide the features that can help you draw conclusions on weaknesses in your product or features.
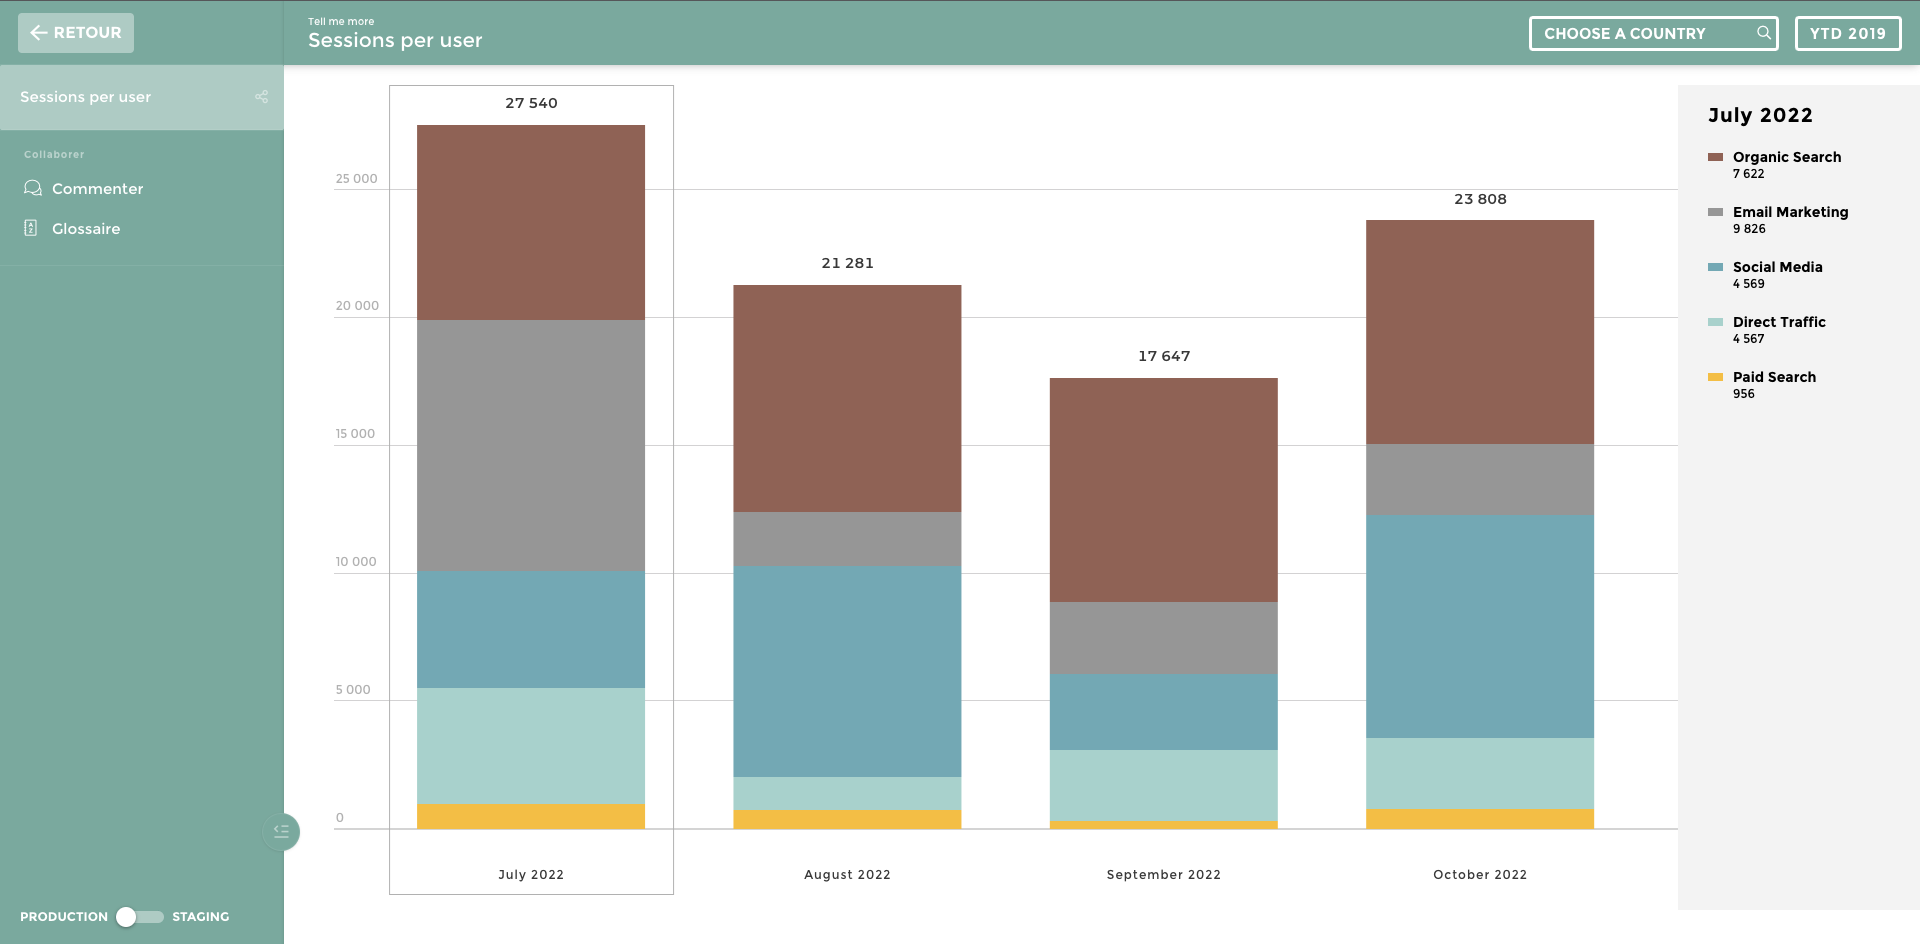
With a tool like Toucan, you can leverage in-app collaboration, annotation capabilities, and color filtering KPIs to create a clear data story of your website metrics. By creating a personalized dashboard that suits your company's needs and goals, you can stay on top of user engagement and make strategy changes more efficiently.


.png?width=710&name=CTA%20Template%20%E2%80%94%20Free%20Trial%20(2).png)