What are the KPIs for Bank Dashboard?
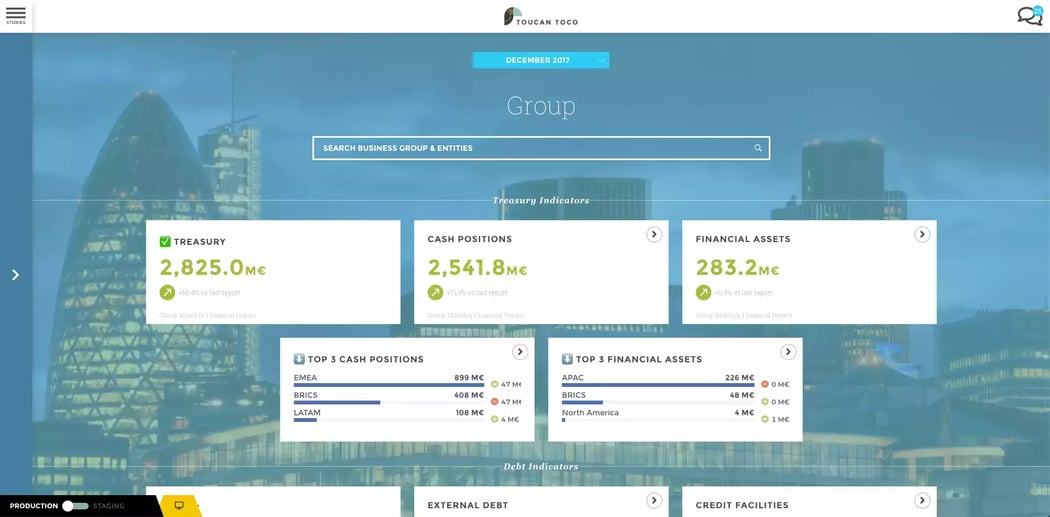
A bank dashboard is an analytical Business Intelligence tool. It allows a bank to monitor its financial performance, customer trends, or even to predict market trends through predictive analysis.
The dashboard can provide information on the performance of a new product and the effectiveness of the pricing policy. It can reveal performance issues, and display real-time operational information such as credit risk, sales force performance, or service usage.
The profitability and the margin achieved by the bank can be analyzed. By providing information on a daily basis, the table makes periodic reporting unnecessary. Finally, valuable information on the institution's past and present performance can be used.

A wide variety of performances can be tracked with this tool. It all depends on the data and Key Performance Indicators (KPIs) that the bank chooses to incorporate into the dashboard. These KPIs are presented visually, allowing for quick and intuitive reading.
The data can come from the bank's various systems, such as its main platform, CRM software, or loan processing software. Customer data allows a better understanding of customer behavior.
Transaction data reveals how quickly transactions are completed, while product data can indicate which products require changes and what customers are requesting in terms of new features.

Payment data can highlight at-risk customers. Finally, promotion data reveals what promotional strategies may have worked in the past so that they can be used again. Generally speaking, a bank's data can be divided into 5 categories: sales, credit, operations, marketing and technology.

Build successfully your bank dashboard
In the finance category, the most interesting key performance indicators to monitor are the bank's revenues, expenses and profit. Other KPIs to track include operating expenses as a percentage of the bank's properties, total property value, or the percentage of those properties outperforming the competition.
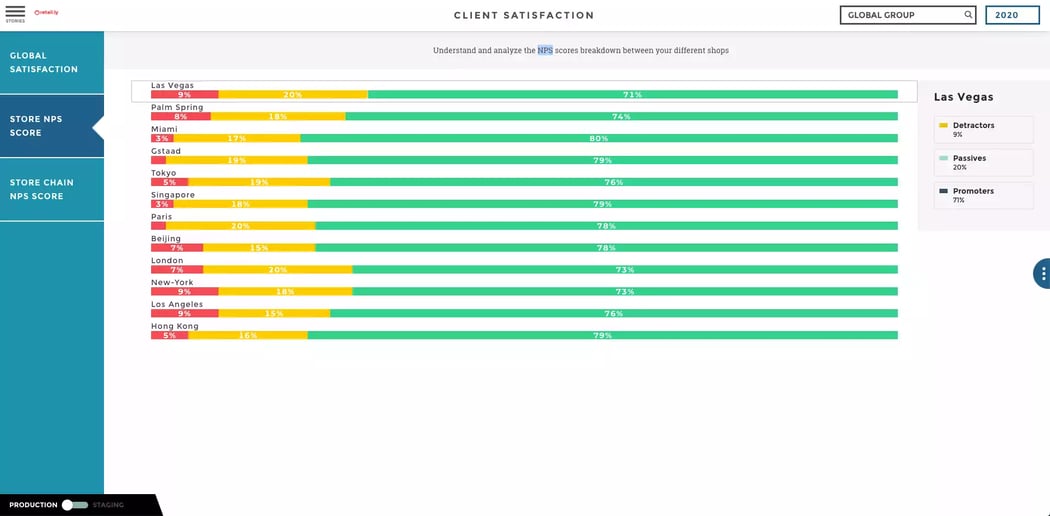
For example, to measure its performance in terms of quality, the bank can use the scores obtained in customer surveys, the average time required to resolve problems, the error rate when creating a new account, and the total number of accounts opened with insufficient documents.
Finally, productivity performance can be measured using indicators such as the total volume of accounts managed by the bank, the total value of the bank's properties divided by its number of employees, profit per employee, sales value per branch, and the number of workflow processes implemented.


