Back


Centered Average - What is it?
A centered average is an ideal tool for comparing volume indicators or flows per entity based on an average. Here's an example of a centered average leaderboard.
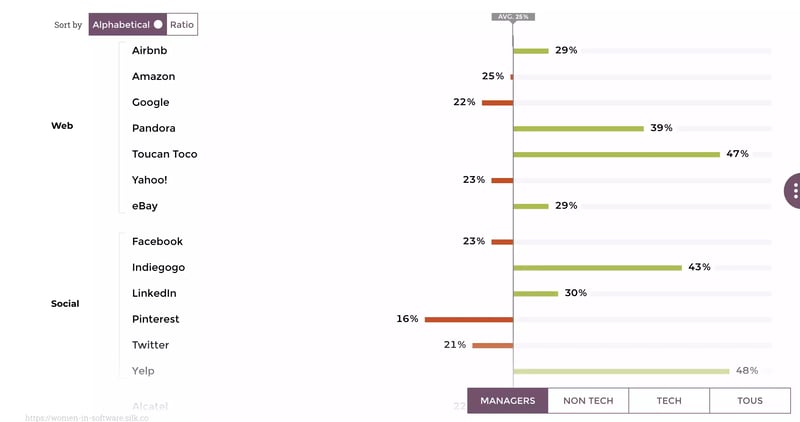
The reference average can be used to represent performance data. Compare the performance of multiple entities or individuals against a goal. This type of graph is often used to study a variety of categories:
- Gender
- Age
- Socio-professional category
Why use a Centered Average?
Many organizations will use centered average to create leaderboards or graphs, which measure employee or consumer performance where relevant to identify a broader trend.
To find the centered average, take all the relevant integers and divide them by the number of integers inputted. For example, a firm wants to find the centered average of payments made to employees in a given year. To find the moving average, the salaries of each employee would be added and divided by the number of employees, finding the mean of the given values.
For example, mobile game developers use centered average leaderboards to allow their users to measure performance compared to other users, while also using a centered average to measure advertising costs, users per month, etc.
Using a centered average leaderboard can be beneficial to measure performance in real-time, a useful tool to maintain efficiency and act on the insights it produces.