Average User Time Spent- What is it?
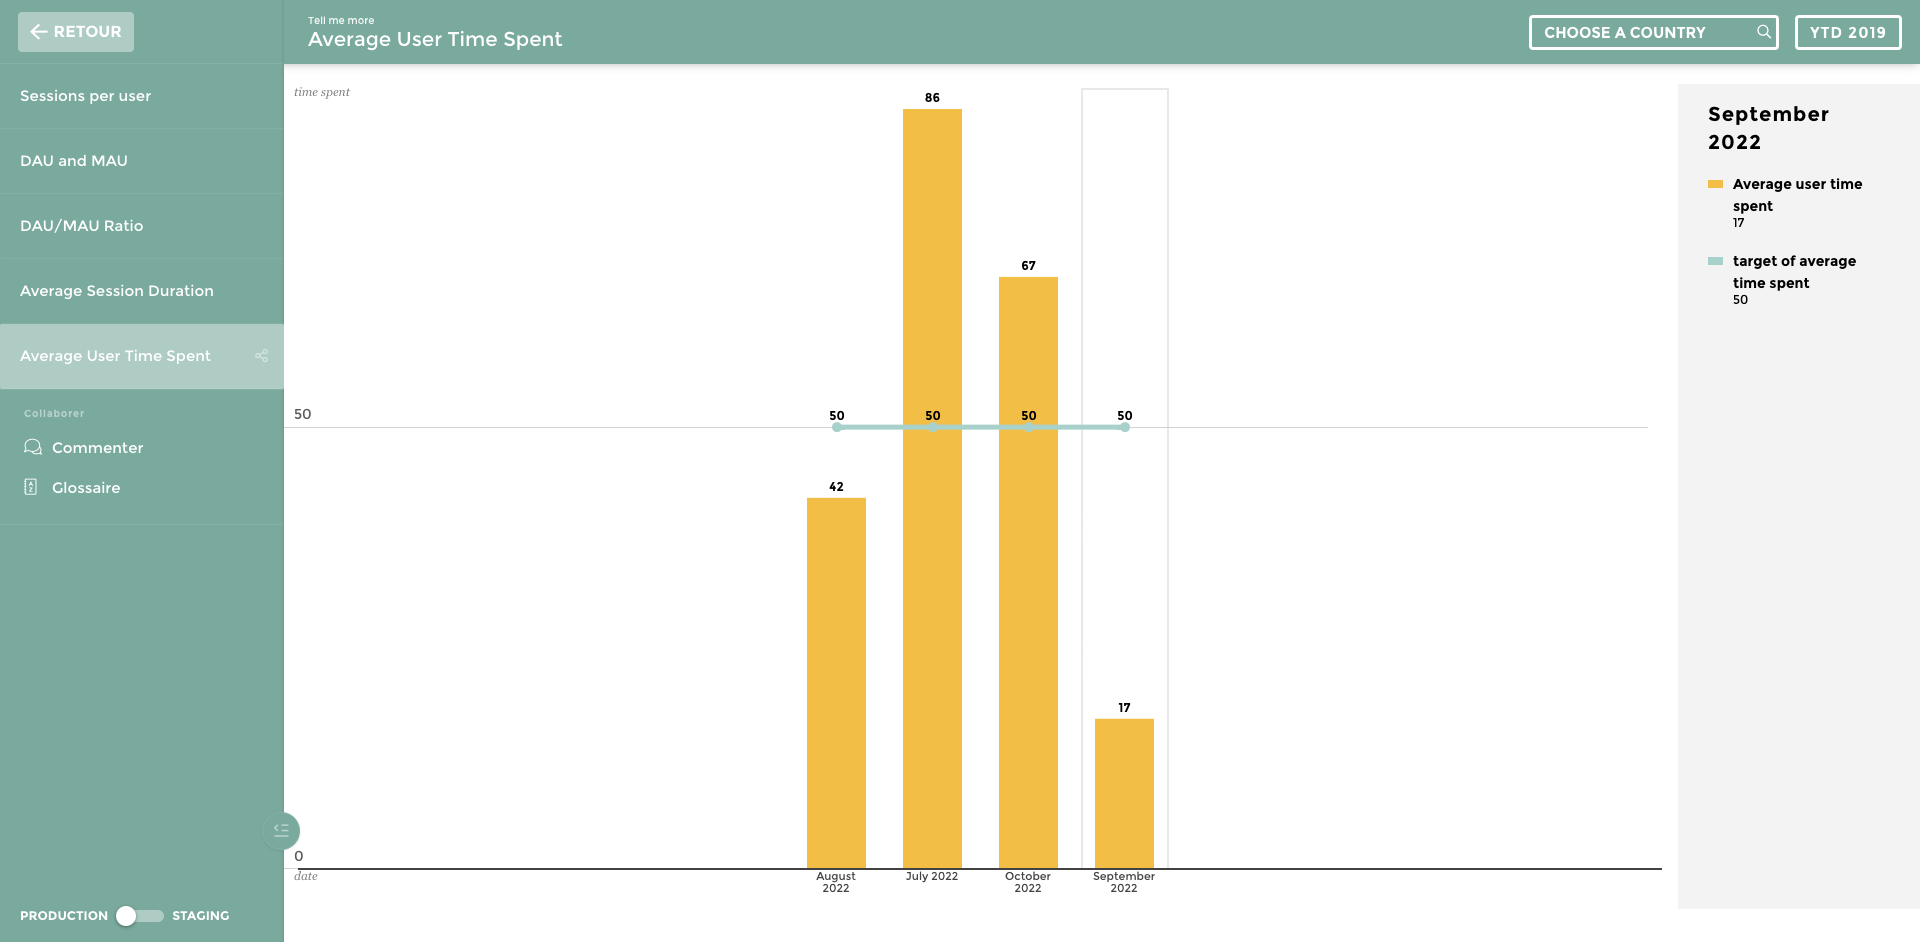
Your product is performing well, but you notice users spending less and less time logged in. Why could that be, and what should you do?
Time spent is a key metric in applications and displays the value that your customers are enjoying while using your product. It also shows your customers' level of engagement.
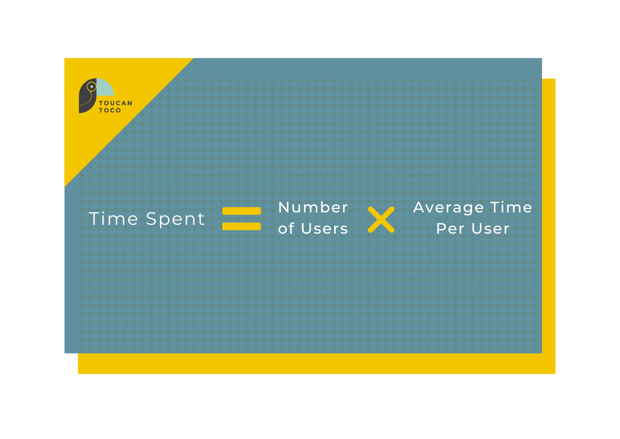
Time spent can be split into two factors: the number of users that an app has and the time each user spends in the app. Monitoring these two components will allow you to calculate the time spent by users on your product.

What Can You Do To Increase Average Time Spent?
Many metrics factor into average time spent, such as monthly active users (MAU) and market share. Here's how you can leverage these two metrics to increase user engagement:
- Identify key features: Understanding how your product's features are performing is a key to increasing the average time spent. If one feature is attracting low user attention, it may be time to revamp or scrap the feature altogether and reallocate resources to a feature that displays high engagement.
- Benchmark retention rate: Understanding how your product's retention rate stacks up against other products in your industry can lead to improved strategies to target new users and increase the average time spent.
- Re-engagement: Launching re-engagement campaigns can lower your customer acquisition cost and reengage existing users.
- Analyze Competition: Your competition is the best source for the average time spent you should be targeting. Cross-analyzing competitor data can help your team set realistic and tangible goals to improve your average time spent.
How To Calculate Time Spent
The average time spent can be calculated by using the following formula:

Your ideal time spent varies on the industry of your business and your competitors. It is important to research your key competitor's average time spent to set an attainable and credible criteria.
Why Should You Track Average Time Spent is Important?
Average time spent is a crucial product usage metric that shows product teams if their product's features and value are engaging their target audiences. Because metrics like retention rate, MAU, and CAC factor into average time spent, a modern analytics solution is necessary to track these metrics in real time.
Tracking the average time spent with a modern analytics solution like Toucan can reveal insights about your users and how much time they are spending logged into your product. Contrasting these insights with your competition's can help you understand how your product is performing and where improvements must be made.


.png?width=710&name=CTA%20Template%20%E2%80%94%20Free%20Trial%20(2).png)