Average Session Duration - Why is it important?
Average session duration is a vital metric for businesses in every industry. Whether it's in retail clothing or a SaaS business, every business that uses its website as a key revenue driver measures average session duration.
So how can you track average session duration and why is it such an important metric? We'll dive into how average session duration impacts a business's bottom line and how to monitor user engagement.

What is Average Session Duration?
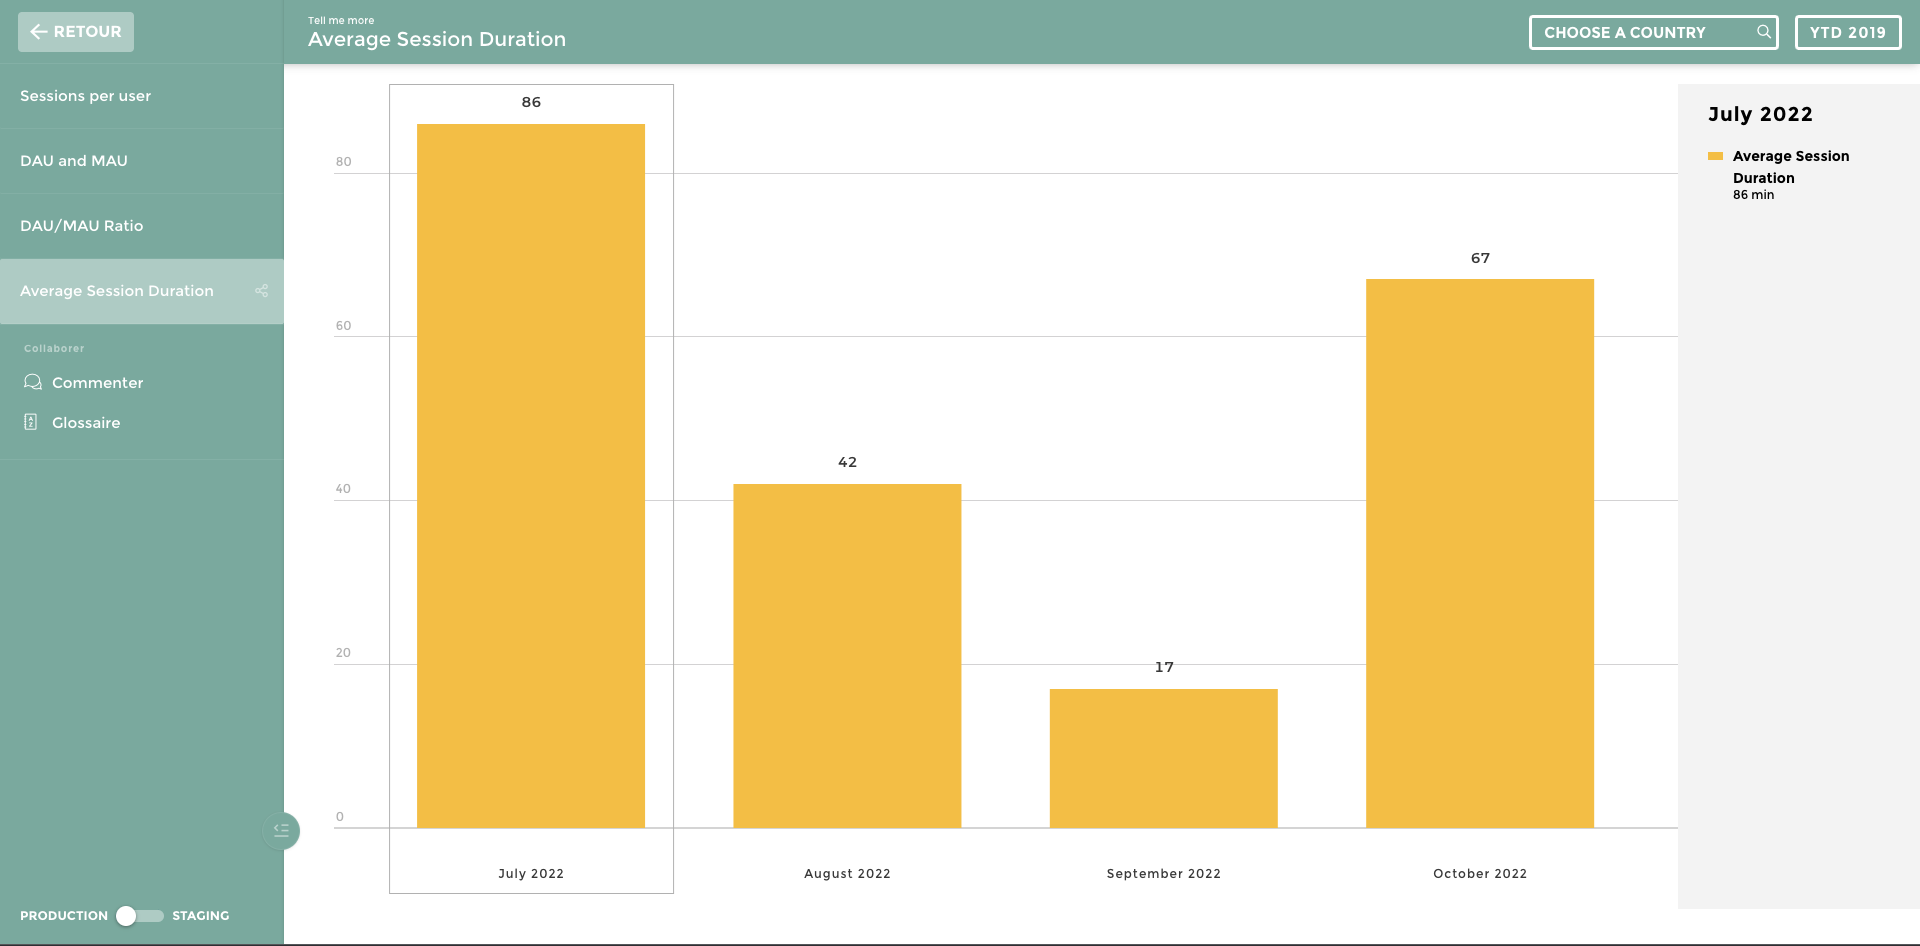
Average session duration is a KPI that measures the average length of sessions on a website. Most commonly, this metric is found in Google Analytics but can also be tracked by using any modern analytics solution.
Here's an example. Let's say a user enters a retail website at 2:00 pm, navigates to find a product, checks out, and exits the website at 2:25 pm. All of those actions happened within the same session, and the session duration for this user would be 25 minutes.
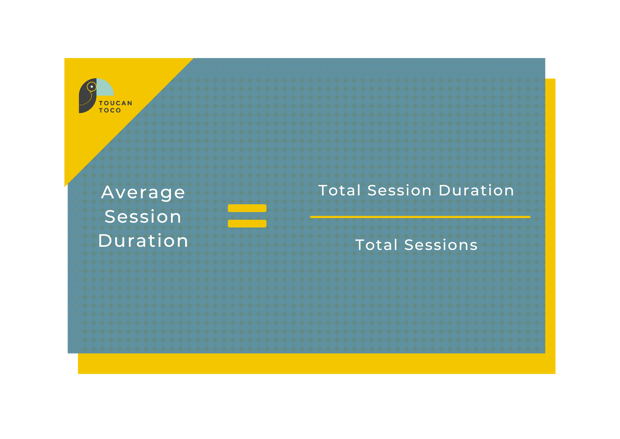
Average session duration takes individual user data and combines it to provide an average metric of user engagement. You can calculate the average session duration by using the following formula:

Let's perform an example calculation. Your website had 400 sessions in a week, of which 300 were 20 minutes long, 50 were 10 minutes long, and 50 were 5 minutes long.
6750 minutes / 400 total session) = 16.85 minutes
Why is Average Session Duration Important?
Average session duration allows a company to understand how long users engage with your website or product. Tracking user engagement is the first step to identifying product weaknesses and monitoring your average customer's product journey.
A great example of this is comparing average session duration to time on page metrics. By monitoring this pair of KPIs, you can get an idea of how long it takes a customer to get through a sales funnel. If it takes customers longer or shorter than usual, you may need to investigate the cause.
How to Track Average Session Duration
Although Google Analytics is the most common solution for tracking KPIs like average session duration, it may not provide the features that can help you draw conclusions on weaknesses in your customers' product journeys.
With a tool like Toucan, you can leverage in-app collaboration, annotation capabilities, and color filtering KPIs to create a clear data story of your website metrics. By creating a personalized dashboard that suits your company's needs and goals, you can stay on top of user engagement and make strategy changes more efficiently.


.png?width=710&name=CTA%20Template%20%E2%80%94%20Free%20Trial%20(2).png)