Here at Toucan, we’re committed to making important data insights accessible to everyone, no matter their data literacy level.
This is why we’ve spent 6+ years building a tool that allows business users to turn their data into compelling stories. Stories that are easy to access, understand and act upon.
But we also know that data stories are nothing if you don’t share them: they become truly important once you put them in front of the relevant people. Only then will your teams be able to use data in order to make their business strategies more effective.
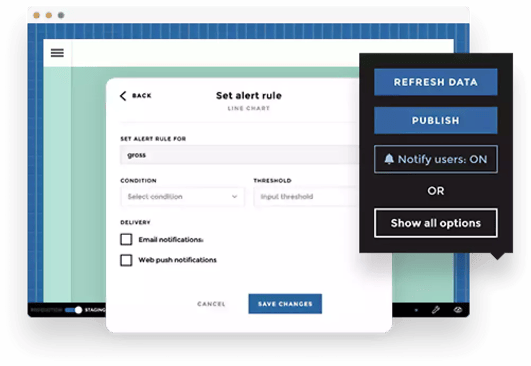
The problem of broadcasting data insights is one we’ve tackled with our new guided business analytics platform, Toucan 2.0. We’ve resolved to make the whole process of analytics simpler. And that include being able to communicate the right data to the right people. We’re happy to walk you through the features that make broadcasting and embedding your data stories easier than ever before.
Embed your analytics where your users are
Embed analytics natively into your app
Where’s the best place to share your analytics with your users? Where they already are! This is why embedding is the future of data analytics. What’s embedding exactly? It's adding an analytics brick in your app, platform, or website, that looks and feels like part of your UX. This way, your users, customers or leads can get access to the numbers that are relevant to them while using your product, without having to navigate back and forth with an analytics app.
No code and no training required
It all sounds very appealing, but how long would it take to implement this? Do you need to get specialized developers or designers on board? With Toucan, the answer is no. We make embedding so simple that you can do it yourself, without the need for extra dev spendings.
Use your charts on any device
Natively built for mobile
The problem with most analytics app is that they’re not adapted for mobile use: they look great on desktop, sure, but once you try to use them on another device (say an iPad or an iPhone), you find the buttons to be too small, the charts too big, and the whole experience underwhelming. This is a particularly big problem if your team is often on the go: meeting clients, visiting franchised stores, car dealerships, or healthcare professionals. They need to have access to important data, and they need it wherever they are. This is why it’s so important for them to have access to their data analytics platform on their mobile device. Toucan makes this possible: every chart, app, or data story on Toucan is responsive and natively available on mobile.
%20(1).webp?width=1185&name=product-slider-visual-tabs-1%20(1)%20(1).webp)
Never compromise on User Experience
UX is our specialty. In 2022, every analytics platform should make the experience of their users a priority. We make sure our users have the exact same Toucan experience no matter their device, without ever compromising on what makes our solution so special: our attention to detail. Whether you’re viewing your data on mobile, on a tablet or on a big screen, your charts are still interactive. Oh, and did we mention data walls? You can display your charts on a big screen in your office or your waiting rooms straight from your Toucan app.

Generate pixel-perfect PDF reports
Automatize your reporting
Data dashboards are amazing tools: they’re interactive, automatically updated, responsive, and can give you a clear view of your numbers at any given time. But sometimes, you need a good old PDF report to pop up in your inbox at the right time. This is also possible with Toucan 2.0: you can automate the creation of pixel-perfect PDF reports. Generate static reports without compromising on the clarity and simplicity of your native dashboards. Share your reports via email, or print them out.
Get technophobes on board with printed reports
Listen, here at Toucan, we all think tech is pretty amazing. But we also know everyone doesn’t necessarily agree on this. Chances are some people on your team are not as enthusiastic about the tools you put at their disposal, no matter how effective they are. And even though our adoption rates are the highest on the market, we know that interactive dashboards are not for everyone. With Toucan, you’ll be able to generate PDFs and print them out for those in your teams who prefer good old paper reports to screens.
If you want to try out our Broadcast and Embed solutions for yourself, just head here!


.webp)