.png?width=860&height=580&name=SQL%20(3).png)
PostgreSQL is a powerful solution that many organizations rely on for managing and storing data. Object-relational capabilities enable this database management system to offer the capability to store a large volume of data and enhance data analytics. Reporting are essential tool in making the data accessible.
The ease with which various PostgreSQL reporting tools can connect with PostgreSQL is certainly a primary factor for consideration. Other features and facets can be important differentiators in the search for a reporting tool that works in your specific circumstances. For example, ease of maintenance, and code or no-code-based, data communication features, maybe other crucial considerations.
Reporting tools can vary in how they perform queries to the database, maintenance requirements, security, and visualization features. As you may understand now, in the reporting tools environment, there is not one solution to answer every need. This can inform the criteria that you use to analyze various solutions.
For each tool, we’ll discuss:
- Who it is made for
- Data level needed
- What it’s known for
- Its Business model
To better understand the landscape, we’ll explore 5 of the best tools to use for PostgreSQL reporting. We’ve selected these tools based on the ease of use, as well as the ease with which they can connect with PostgreSQL, and we’ll be exploring tools that are applicable for a wide range of use cases and offer a wide range of models and pricing systems.
#1 Toucan | Data Storytelling and Embedded Analytics

Who it is made for: who need to communicate data internally and externally
Data level needed: Intermediate
Known for (Specifically): Customer-facing analytics and data storytelling
Business model: open source software based on a subscription model
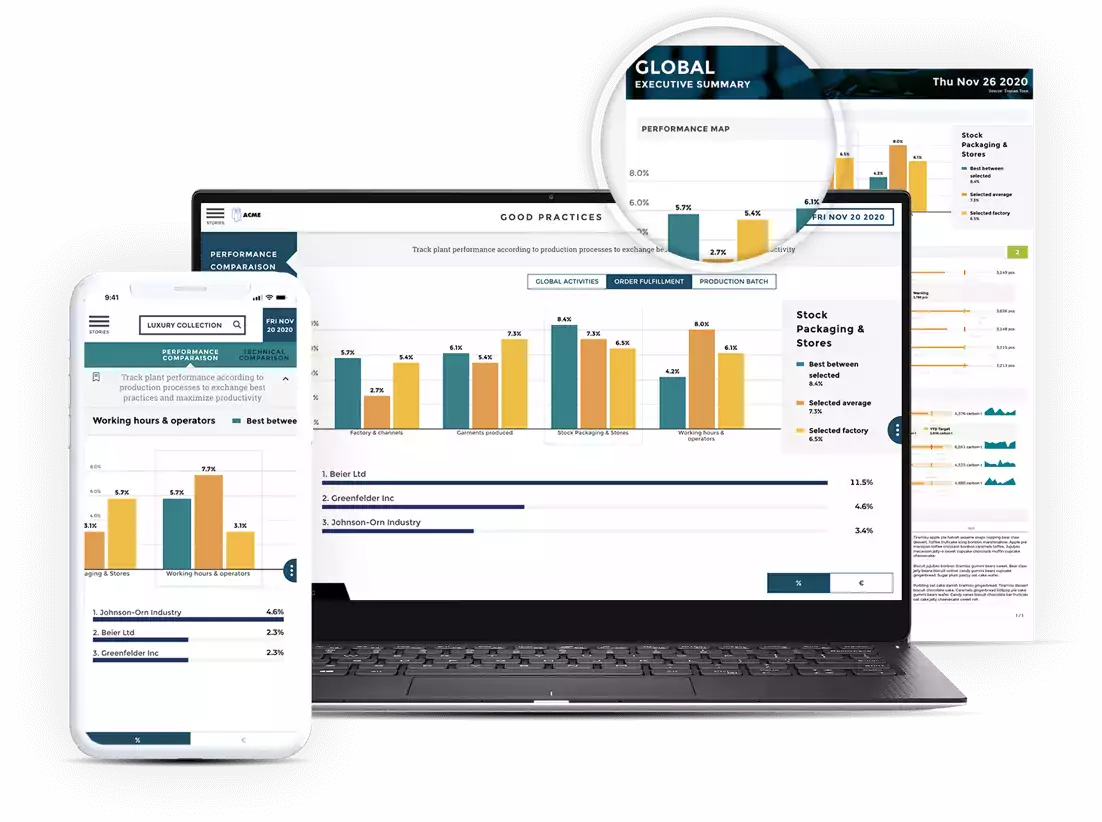
Toucan (Hi there 👋) is an excellent choice for customer-facing analytics. When it comes to leveraging insights, sharing them effectively is half the battle, which is what Toucan aims to help teams accomplish.
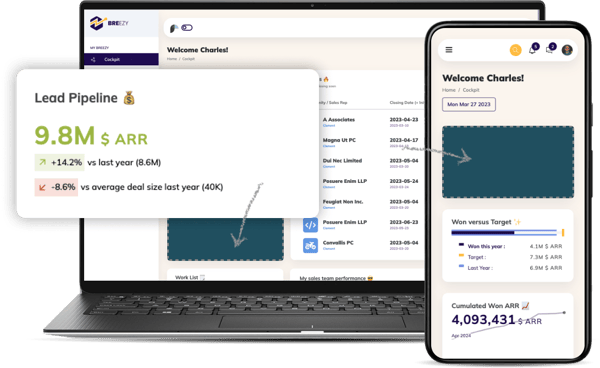
Toucan’s most notable features include its ability to create data stories for customers and quickly embed analytics nearly anywhere — in apps, embedded web pages, or in a standalone experience. Toucan is designed to enable teams to quickly and effectively create compelling narratives from their data.
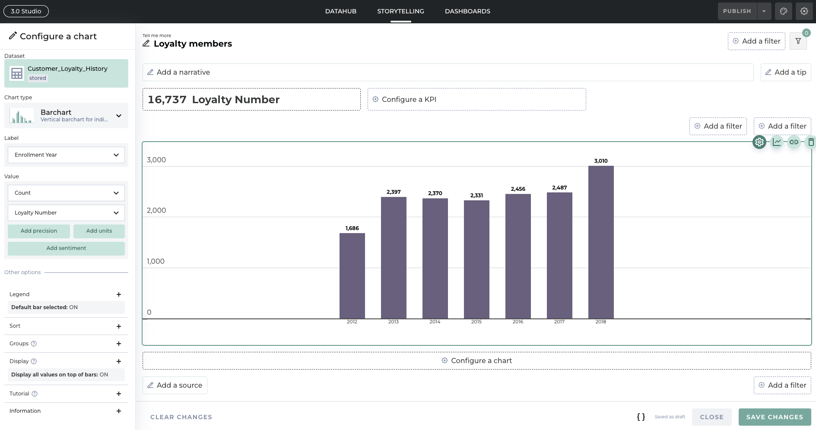
With a Storytelling Studio, Toucan is designed to make it easy to share insights and visualize data in an accessible manner. For data teams creating customer-facing narratives, Toucan makes it possible to tell a story compellingly and engagingly.
What’s more, in addition to PostgreSQL reporting, Toucan boasts an impressive range of data sources and integration support with AnyConnect™, designed to make connection with your data seamless and simple
To learn more, visit:
#2 Mode | Data exploration for advanced data teams
 Who it is made for: Advanced data team
Data level needed: Advanced
Known for: Notebook for Python, SQL, or R queries
Business model: SaaS
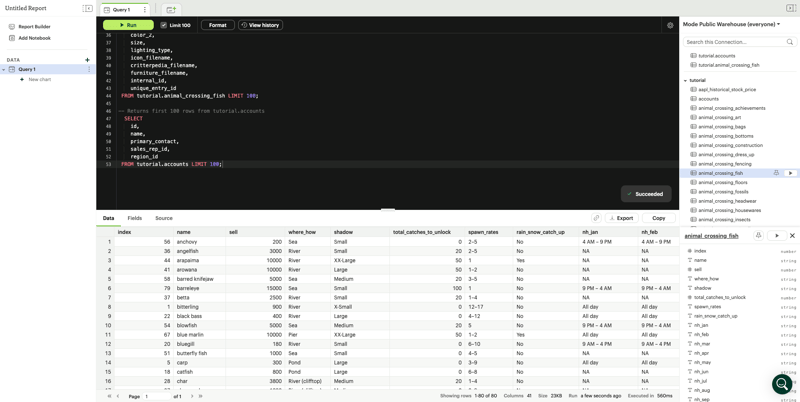
Mode is an all-in-one analytics platform that offers users self-service capabilities and the ability to query multiple sources and tables, make dashboards, and visualize data. For a notebook code-oriented reporting tool, with advanced exploration capabilities, Mode stands out as a serious contender.
While Mode offers advanced analytics capabilities, this platform is mainly for data experts. Specific chart features are easier to use and could be used by others than data people. However, Mode focuses explicitly on enabling data exploring data, gathering insights, and communicating them visually. Mainly to answer specific questions with data-driven answers.
In addition, Mode offers an extensive governance system that ensures the right datasets are shared with the right people, guaranteeing access to relevant data for everyone. Mode truly shines when it comes to creating one-time reports.
It provides a free studio version, as well as two paid versions - Business and Enterprise.
#3 Redash | Open Source SQL notebook

Who it is made for: Data teams
Data level needed: Intermediate
Known for: Open source project
Business model: Open Source project, 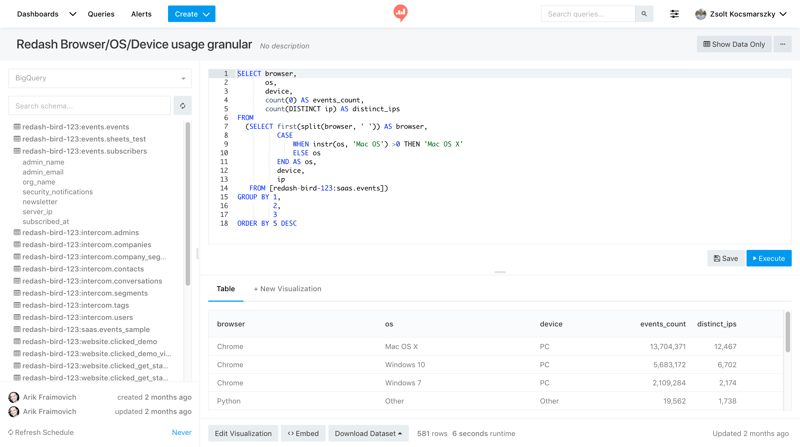
Redash is an open-source solution used for data visualization and to create dashboards. While Redash offers functionality that’s designed for user-friendliness, this option may be well-suited for more technical users who are familiar with SQL.
Among Redash's capabilities, external integrations and reporting-sharing capabilities stand out as some particularly notable ones. Redash is well-suited for technical data users who wish to share insights and relationships with others within the organization. With query caching, Redash offers a quick way to revisit queries and a user interface optimized for speed.
Redash’s data visualization capabilities, user-friendly interface, and query caching can all make it an excellent candidate, especially for organizations looking to leverage insights from tech and data teams at a limited cost
As a popular open-source project, Redash offers organizations the ability to extensively customize and rely on an active community. While this type of customization may necessitate some tech-savvy users on the team, it can also be highly cost-effective and efficient in the long run.
#4 Tableau | Business intelligence platform
 Who it is made for: Data and business teams
Data level needed: Advanced to expert
Known for: data exploration and data visualization
Business Model: Tiered pricing options based on the number of users
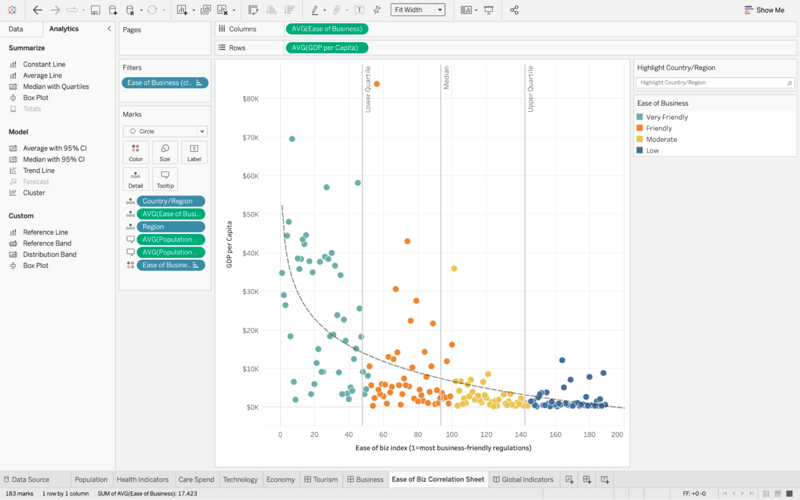
Tableau is a popular Business Intelligence (BI) platform and is renowned for its powerful exploration capabilities tailored to data analysts and professionals. It caters to advanced and expert users, empowering them to delve deep into their data and create both basic and advanced visualizations
Tableau supports connections to PostgreSQL databases, making it an effective way to analyze and visualize your PostgreSQL data. With a powerful drag-and-drop interface, Tableau can be equally at home for data-heavy users. Tableau offers both self-hosted and supplied cloud-hosted solutions, as well as a wide range of licensing options to meet the varying needs of different organizations.
With a wide range of built-in connectors and robust data management capabilities, including data prep, data lineage, and data governance, Tableau offers a comprehensive solution for data professionals. However, it's important to note that Tableau comes with a higher price tag, starting at $900 per year for a single builder. While it aims to be the go-to tool for cross-source exploration, the web version may experience slower performance with joins, refreshes, and building dashboards. In comparison, the server option may seem somewhat outdated compared to the latest tools on the market. Nevertheless, the versatility of Tableau comes with a learning curve. Be prepared for a challenge.
The Bottom Line
When it comes to getting the most out of PostgreSQL, visualizing and reporting can be important. When it comes to finding the right tools, not all reporting solutions serve the same purposes or focuses. As such, it can be important for teams to better understand their needs and the various capabilities and offerings of some of the most popular tools on the market. We’ve explored some of the top contenders when it comes to finding reporting tools that work with PostgreSQL and explored how their different offerings might make them ideal in a range of use cases.
If you’re looking for a solution that enables you to create compelling, easy-to-understand customer-facing reports — don’t hesitate to reach out. At Toucan, our focus is on creating solutions that enable you to go beyond just the data — creating compelling narratives and sharing them across a wide range of platforms to suit your needs. To see it for yourself, don’t hesitate to get a demo today!


