Imagine understanding your customers better, without a hefty price tag or privacy concerns. That's the power of open-source analytics tools. Forget expensive software – these community-built solutions let you see your data clearly, customize it to your needs, and keep it all under your control.
From website traffic to user behavior, open-source analytics empower you to make smarter decisions, faster. Let's dive into the top 10 tools to unlock the data revolution for your business.
The best tools for analytics
1. Matomo
The "powerhouse" of open-source analytics, Matomo offers a comprehensive suite of features that can compete with Google Analytics. Dive deep into visitor behavior with in-depth visitor tracking, analyze conversions to understand what drives sales, and generate detailed reports to identify trends and make informed decisions. Unlike closed-source solutions, Matomo prioritizes data ownership and privacy compliance. You control your data and decide how it's used, ensuring you remain GDPR and CCPA compliant.

2. Plausible Analytics
For a lightweight and privacy-focused approach, Plausible Analytics is your champion. It focuses on essential website metrics that matter most, like unique visitors, pageviews, bounce rate (percentage of visitors who leave after just one page), and referrers (where your website traffic comes from). The simple interface makes it easy to understand key website trends, and its commitment to user privacy makes it ideal for businesses that prioritize data protection.

3. Umami
Inspired by Matomo, Umami offers another privacy-focused option for basic website analytics. It provides a clean and user-friendly interface that's easy to navigate, even for beginners. This makes Umami a great starting point for those new to website analytics who want to understand their website traffic and user behavior without compromising user privacy.

4. PostHog
Go beyond basic website metrics and delve into the user experience with PostHog, your one-stop shop for product analytics. It offers a treasure trove of features:
- Session recordings: Witness user journeys firsthand with session recordings. See exactly how users interact with your product, identify pain points, and understand how they navigate your features.
- Feature flags: Experiment with confidence using feature flags. Gradually roll out new features to a controlled group, measure their impact, and iterate based on user data before a full launch.
- Funnel analysis: Track user flow through specific paths within your product using funnels. Identify drop-off points and optimize your conversion process for maximum user engagement.
- Heatmaps: Visualize user clicks and scrolls with heatmaps. Understand where users focus their attention and identify areas for improvement in your product design.
- A/B testing: Make data-driven decisions with A/B testing capabilities. Test different variations of your product interface or features to see which ones resonate best with users.

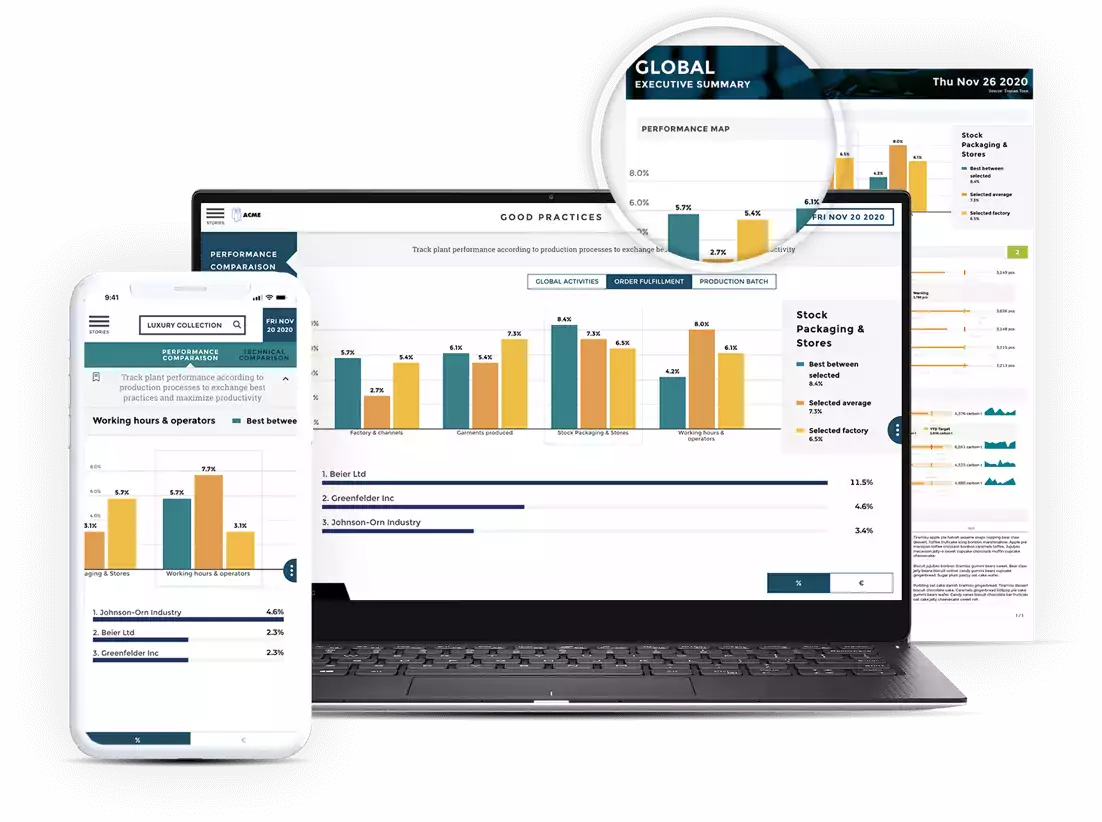
5. Toucan - for customer-facing analytics
Toucan is not properly said an open source, only there visual query builder is. , but toucan worth a mention: designed to empower users to craft engaging, data-driven stories. Known for its user-friendly interface and strong emphasis on visual storytelling, Toucan enables users to convert complex datasets into accessible and actionable insights without ne eding deep technical expertise. The platform supports a variety of data visualizations to suit different narratives and audience understandings, making it a popular choice among non-technical users.
Key features:
- Visual-first approach: Prioritizes visual data presentation, supporting various charts, graphs, and interactive elements.
- No-code platform: Allows users to create and manipulate data visualizations through a straightforward drag-and-drop interface.
- Collaboration features: Enables teams to work together seamlessly, with shared dashboards and real-time updates.
- Customization: Offers extensive options for customization to align with brand colors, logos, and themes.
- Integration capabilities: Easily integrates with multiple data sources including SQL databases, Google Sheets, and more.

6. Apache Superset
For those comfortable with SQL, Apache Superset offers a powerful BI tool brimming with advanced features:
- Robust SQL editor: Craft complex queries with ease using the built-in SQL editor. This empowers you to slice and dice your data with precision, uncovering hidden patterns and trends.
- Advanced visualization options: Go beyond basic bar charts and pie charts. Apache Superset offers a wide range of advanced visualization options to communicate your data insights effectively.
- Steeper learning curve: Be aware that Apache Superset caters to a more technical audience. If you're new to SQL, you might have a steeper learning curve compared to Metabase.
Despite its technical nature, Apache Superset empowers developers and data analysts to delve deep into their data and create sophisticated visualizations.

7. Grafana
You might know Grafana for its prowess in infrastructure monitoring, but its capabilities extend to website analytics as well. Here's what makes it a compelling option:
- Real-Time visualization: Gain live insights into your website traffic with real-time visualization capabilities.Monitor key metrics like user visits, conversion rates, and bounce rates as they happen.
- Data source integration: Connect Grafana to various data sources, including your website analytics platform, to create unified dashboards for both website and infrastructure health.
- Strong existing user base: If your team already utilizes Grafana for monitoring purposes, leveraging its website analytics capabilities offers a seamless integration.

By extending its functionality, Grafana provides a powerful analytics solution for teams with existing monitoring workflows.
8. OpenReplay
Ever wondered what users are really doing on your website? OpenReplay unlocks the secrets of user behavior with session recording and playback capabilities. Imagine:
- Witnessing user interactions: Replay user sessions and see exactly how users navigate your website. Analyze clicks, scrolls, and form interactions to identify friction points and areas for improvement.
- Mouse movement tracking: Gain insights into user attention with mouse movement tracking. See where users focus their attention and identify areas that might be confusing or difficult to navigate.
- Optimizing website flow: By understanding user behavior, you can optimize your website flow for a seamless user experience. This can lead to increased conversions and improved user satisfaction.

OpenReplay empowers you to see your website through the eyes of your users, providing invaluable insights for optimizing your website and user experience.
9. GrowthBook
For product teams focused on experimentation and iteration, GrowthBook is a game-changer. This open-source feature flag management tool allows you to:
- Controlled feature rollouts: Gradually release new features to a controlled group of users before a full launch.This minimizes risk and allows you to gather valuable feedback before exposing everyone to potential issues.
- A/B testing made easy: Test different variations of your product interface or features with A/B testing capabilities. See which versions resonate best with users and make data-driven decisions for product optimization.
- Iterate with confidence: By leveraging feature flags and A/B testing, you can experiment and iterate on your product with confidence. This ensures you're continuously improving the user experience and delivering the features your users truly value.

GrowthBook empowers product teams to move beyond guesswork and make data-driven decisions that drive product growth and user engagement.