Plateauing analytics adoption and why this Will change
We have known about the immense power of data for a while now, but adoption remains below expectations. You could attribute this to a number of reasons:
- Data science expertise is difficult to find
- Not many devices have the computing power needed for analytics
- There are gated data access and limited democratization, which makes the investment unfeasible.
Because of this, Gartner found data analytics adoption to be as low as 30%. Even worse, this number increased by just 7 percentage points in just 10 years.
But now, owing to the unprecedented challenges of COVID-19, data and BI/advanced analytics have become the “holy grail” for businesses looking to survive, adapt, and grow. Studies confirm this trend:
- 49% of companies are either launching new analytics projects or moving ahead with ones already on the pipeline, as of May 2020
- Only 8% of initiatives/projects stand canceled
- Nearly one out of three business leaders think collaborative BI is vital in this mass WFH environment
- Between February and April of this year, the use of self-service BI grew by 9 percentage points
Let’s zero in on that one critical phrase – collaborative BI.
Traditional data analytics doesn’t address the need for collaborative BI
In the same study, during the lockdown, nearly every business leader said that 100% of their workforce is now working from home, with no access to their usual workstations, or company-installed on-premise data applications.

Unfortunately, this reveals an inherent gap in traditional BI and data analytics.
One can’t deny that BI platforms have done a phenomenal job of helping data experts become independent of It when crunching numbers, maneuvering data sets, and finding insights. And over the years, BI tools have tried to become more business-focused, targeting specific real-world questions (like the ones we mentioned at the very beginning).
However, the intended users of these tools – the HR manager, a sales rep, or an ops specialist – aren’t trained to be data literate. Meanwhile, traditional BI continues to evolve on legacy systems, making widespread adoption more and more difficult. This dissonance is even more resonant during a crisis such as that of COVID-19.
Right now, companies must absolutely scale up their data capabilities and ensure analytics reach at every tier of their organizational hierarchy if they are to make the right decisions. There is very little margin for error here. As traditional BI requires a long training cycle, effort-intensive dashboards, and a complex distribution process that cut into your time-to-value, making it collaboration-friendly is a massive challenge.
These tools and platforms aren’t designed to help business users working from their living rooms, at non-enterprise-grade computing prowess, share insights on the fly. And although a few employees have since found their way back to their offices, COVID-19 has profoundly changed our work lifestyles and most have opted to work now. As a result, the same problems remain with BI tools' work-station requirements.
The need for a new breed of analytics platforms: DATA COMMUNICATION
Platforms meant for Data Communication help you cut through the clutter, find the insights, and communicate this message loud and clear. It doesn’t aim to enable hours spent on data exploration – instead, it introduces the simplicity and clarity needed to tackle a business crisis.
How does Data Communication differ from traditional BI? There's a four-fold answer:
- It reduces the number of non-value-adding decisions needed to arrive at an insight. What color do I choose for a dashboard? Does this line make the dashboard easier to read? Data Communication gives you a select set of options without tinkering.
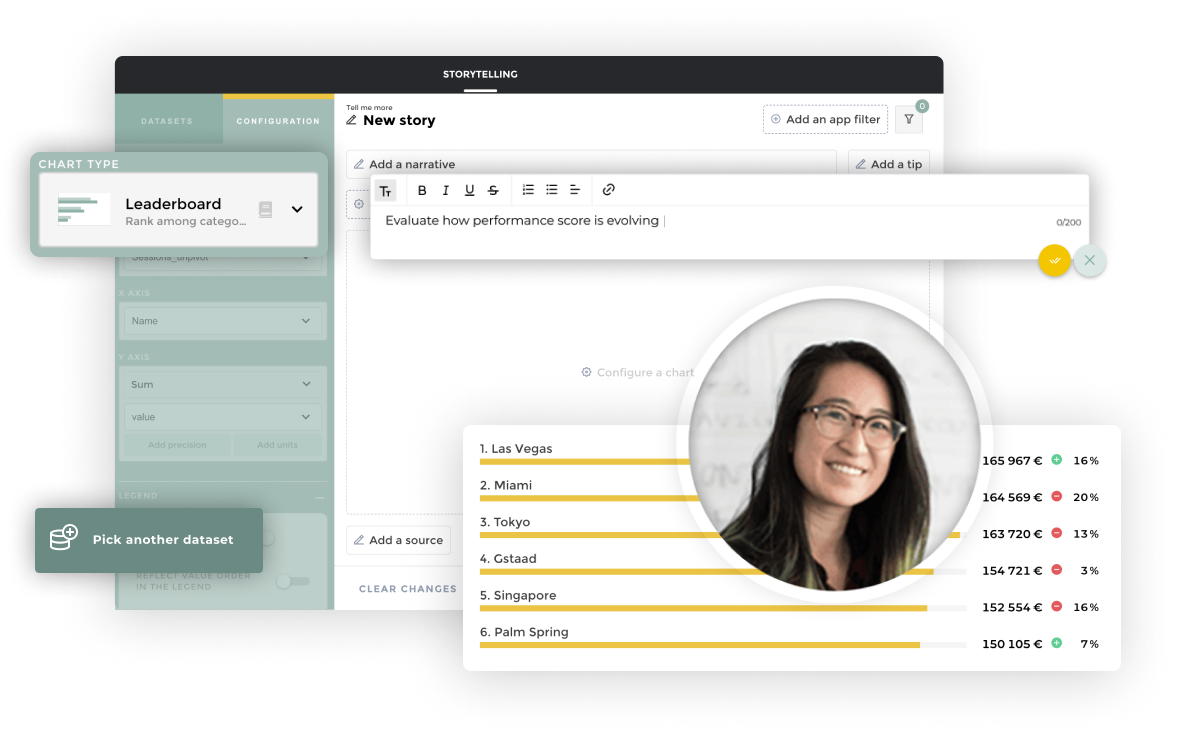
- It is squarely focused on your data story. The faster your platform provides the user with insights, the greater will be your adoption rates. To achieve this, Data Communication is built around the principles of storytelling, making it as easy as possible for the user to glean insights.
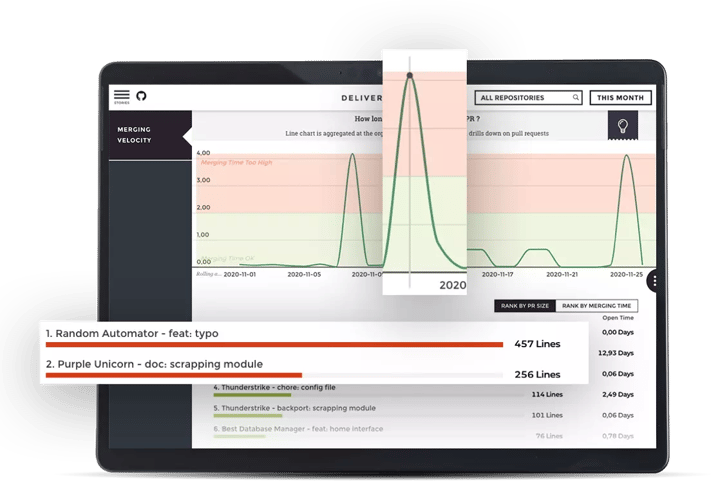
For example, traditional BI and Data Communication will both give you a rich library of charts, but the latter will limit visualization to two charts per page, so as not to overwhelm the user.
- It will include expertise-driven visual cues. DataViz best practices tell us how to maximize information legibility and resonance. For example, the choice of font can optimize the data reading experience, and ease information consumption.
Unlike traditional BI, a Data Communication platform will auto-recommend these configurations to help understand and share information better.
- It is less time, effort, and cost-intensive. As Gartner notes, getting a dashboard up, running, and adopted, takes a village. You have to invest in dashboard designers, technology administrators, and BI training personnel over and above your license costs.
Data Communication is more suited to a crisis period, as it reduces these intermediary investments, and lets you respond faster.

But, contrary to popular belief, Data Communication doesn’t compete with BI. They are complementary because one is for data scientists and one is for non-technical people. With the same level of information within the company, everyone can exchange the same insights and make relevant decisions. How?
Data communication takes your existing analytics bedrock and gives it a democratized, expertise-driven, and collaboration-ready overlay. It's built-in UX and packaged best practices take care of the complex backend so that your workforce – from CxOs to new employees – can make magic using the front-end interface.
Use a Data Communication Platform to solve emerging use cases
During this pandemic, the use of digital in business and innovation around solutions in this sector has seen its capacity to evolve in 3 months what it would have achieved in 3 years. Several new and unexpected use cases have sprung up, and it’s possible to answer all of them with the right data, visualized effectively – whether its managing employees’ health, planning inventory, balancing your marketing costs, or rolling out fidelity programs.
Your platform will ingest data from the necessary sources to present insights that are comprehensible, actionable, and shareable. This is what helped us at Toucan Toco achieve a High Performer positioning in the G2 Summer 2020 grid, and we are thankful to our customers for their trust and great collaboration.
As analytics investments remain stable (according to 40%+ companies) or increase (40%) this year, an adoption-friendly platform could make or break success.


