What information do sales teams need ?
As the manager of a sales team, you need to ensure that you never miss an opportunity. You have to determine the best moment to take action, whether in terms of allocating resources or adjusting your team’s strategies.
By keeping track of your sales team’s performance, you can help them work towards the goals that have been set, both individually and as a group. To do this, your team needs to have access to a great deal of data.
They need a resource that is easy to use, always up-to-date, and can be accessed while in the field.
With the help of business intelligence and data visualization, all the data that sales teams need to perform effectively can be made available via a reporting dashboard.
But how do you determine which indicators will address the needs of your sales force?
Which indicators should you track ?
Sales teams need access to a great deal of information. To manage your sales force more effectively, it is essential to provide your team with the various different types of data that they require.
Here are a few examples of indicators that can be included in your sales dashboard. Offering information on your team’s sales performance, lead generation and productivity.
Indicators for tracking sales
At the end of each sales cycle, have my prospects become clients ?
Salespeople need an overview of their own sales performance, as well as that of their team.
Your dashboard should track sales opportunities, as well as the number of calls made, the success rate, and the average sales cycle length.
Indicators for analyzing and evaluating lead generation
Are my teams contacting the right people, and if so, at the right time ?
How do I know when I should let go of a cold lead ?
Lead generation is a key areas of focus for sales teams. They need access to indicators that will enable them to evaluate and analyze their performance, in order to identify best practices and determine any areas for improvement.
This means that your dashboard needs to show the number of new opportunities available to your teams, the percentage of leads that have been followed up with, as well as the percentage of qualified leads.
Assessing the productivity of your sales teams
Are there any improvements that can be made to my team’s schedule ?
To determine this, your dashboard needs to show how much time is spent on various different activities, such as sales, entering data into the dashboard, and lead prospecting.
What other indicators can benefit my sales teams ?
Other KPIs that could be valuable for your sales team include: the cost of sales compared to revenue earned, the market penetration rate, the company’s growth rate over a given period of time, and customer value.
An example of sales reporting
Here is a concrete example of a sales dashboard that addresses several of the needs mentioned above.
An effective sales dashboard needs to be easy to use. It must enable all users to understand the data it contains, regardless of their level of experience with the platform.
The data must be presented clearly, preferably via a user interface that first offers a global perspective on the topic, followed by increasingly detailed information.
This first page offers managers, team members and other stakeholders a global summary of sales performance. Users can easily view the overall performance of a team or a salesperson in a given period (week, month, quarter or year).
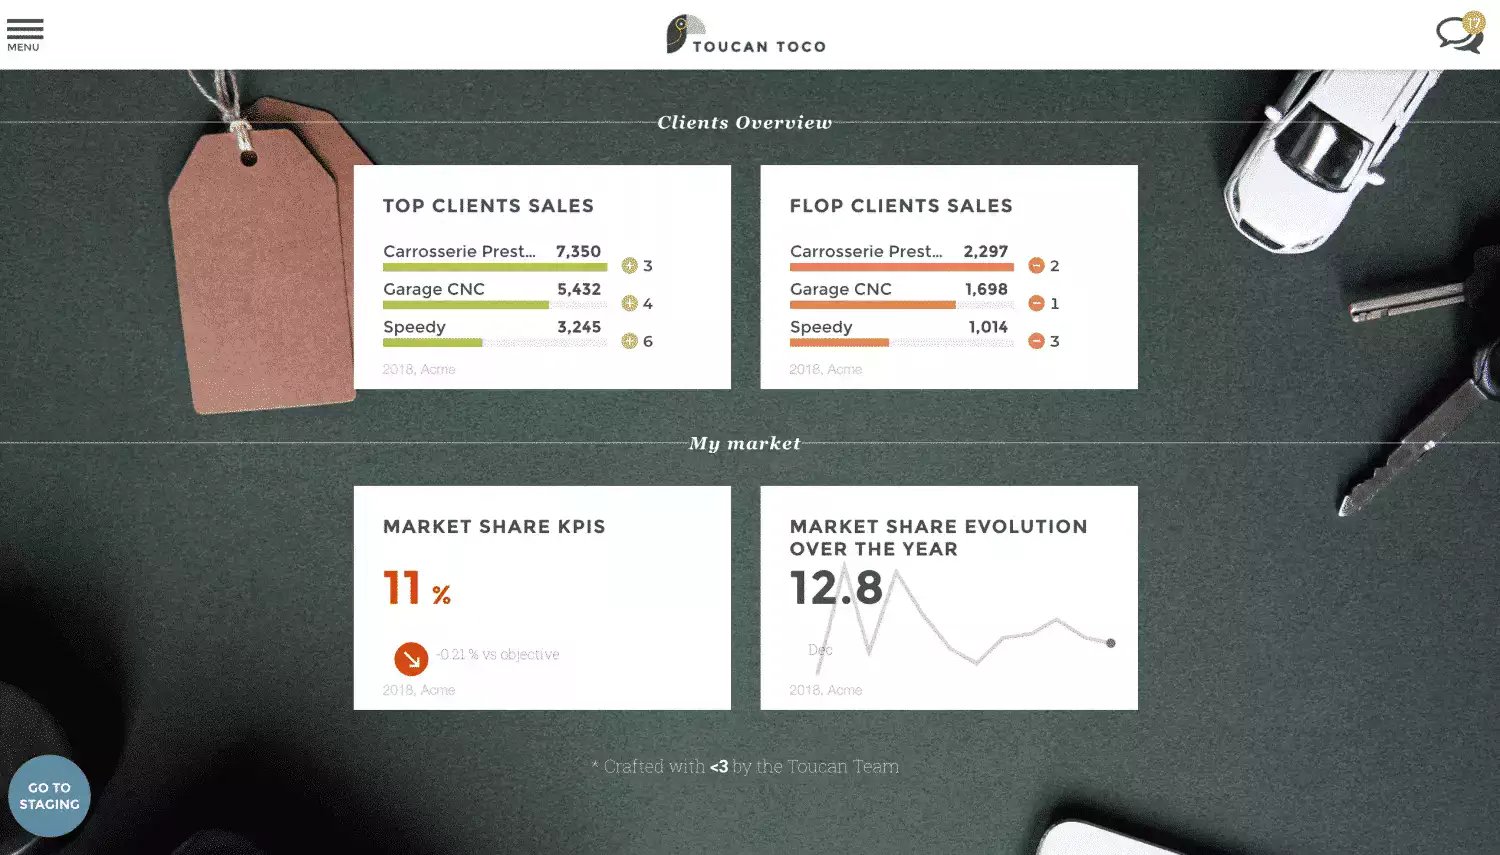
This offers a comprehensive overview : to the right, we can see how close they are to meeting the annual target. In the image below, we can see which sales are seeing the most success, and keep track of market data.

Users can then obtain more detailed information, taking an in-depth look at team, client and market performance.
Performance
Have my sales teams achieved their annual objectives ?
This example offers a clear perspective on sales results (both turnover and volume).
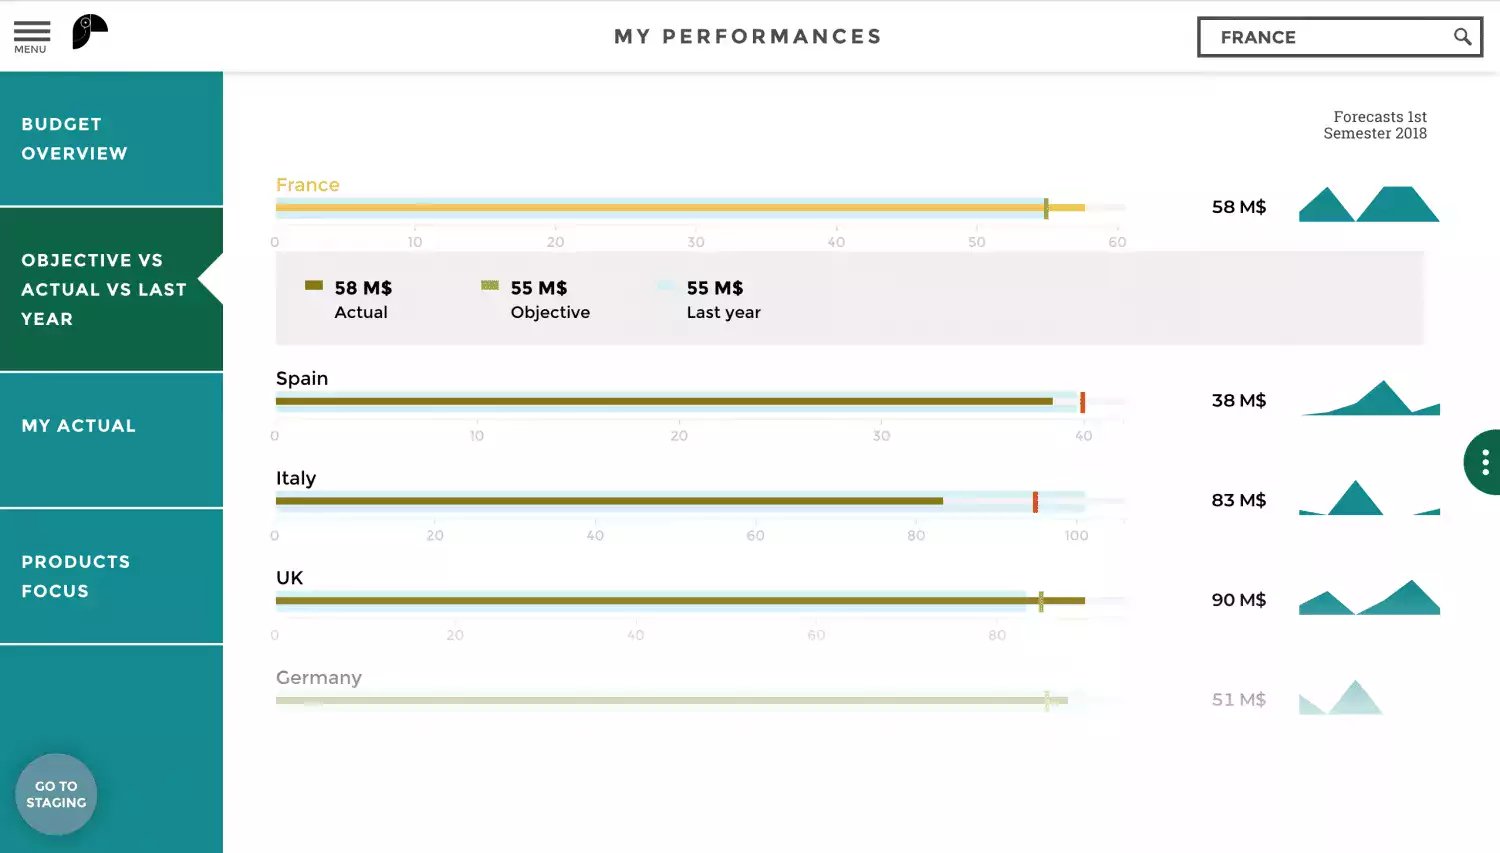
In the second section, we can also see whether or not the annual objective has been achieved, and compare it to the previous year.
Here we can see that for France, performance goals have been exceeded and sales results have improved compared to the previous year. This is not the case for Italy and Spain.

How have my sales results changed compared to last year, product by product ?
In this section, we can see which products have sold well and which have not, organized by type of product. Again, we can view both turnover and volume. Here we see that the perfume Dior j’Adore has not sold as well as it did the previous year. Which saw 511 more units sold.
Conclusion : How can I manage my sales team more effectively ?
Providing your sales teams with an effective way to access key data is essential. Choosing indicators and setting goals together will motivate your team members and ensure that they are working towards the same objectives.
This tool must enable them to measure their performance in the short, medium and long term. The dashboard must offer them a way to view both individual and group results, providing data on sales, clients and the market.
Reporting makes your data actionable, leading to faster and more effective decision making. This is why we recommend including data visualization in your sales team management strategy !
If this problem speaks to you, discover here the experience of la Banque Postale with Toucan Toco.
Discover our product offer for Sales Management, Sales Dashboard and Sales Monitoring !
Charles Miglietti, Co-founder @Toucan Toco
ABOUT TOUCAN TOCO


