Everyone wants more data. Every business. Every team. Every user. And that’s great when you’re an expert who can understand the data and its context, but it becomes an issue when you are relaying complex data to an unspecialized audience.
So the question is: how do you explain your data better and ensure that a larger audience can understand the key points and, most importantly, remember them? The key? Data storytelling.
Effective data storytelling can turn even the most complicated data sets into something that an uneducated audience can understand, remember, and use. It’s how we transform raw numbers into a narrative.

But data storytelling requires skills, expertise, and tools of its own. In this article we will explain how data storytelling can improve how you communicate your data to a larger audience and provide you with the tools that you need to start turning your data into an understandable narrative.
The problem with raw data
It takes a great deal of expertise to properly understand raw data. Part of what makes people good at their jobs is their ability to understand data and information that is very specific to their role.
The thing is, that data is often relevant to a larger audience and that puts experts in the difficult position of having to explain information in a different way. Raw data might work for them, but it won’t work for non-specialists.
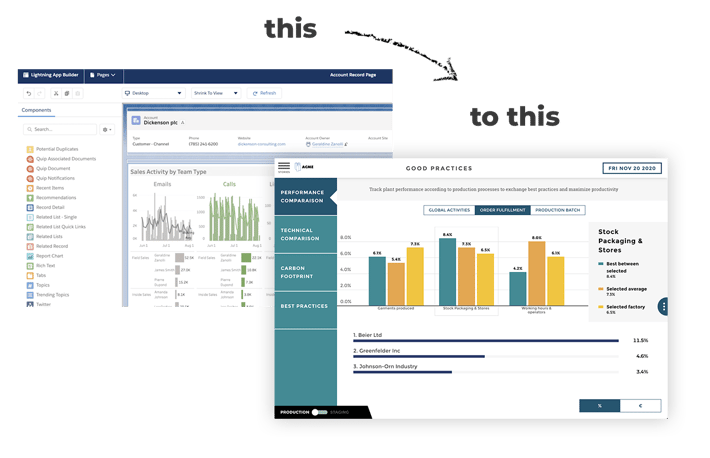
We can all look through a spreadsheet and get some sense of what the numbers might mean, but we will likely miss the key insights or not understand their significance. Conventional tools give us some ability to transform that data into a more visually pleasing form, but this tends to be extremely limited.
A basic graph or a chart is an improvement on a spreadsheet, but without a clear narrative, it still puts the audience in the position of having to do the heavy lifting of picking through the information for the key insights.
Data storytelling solves this problem by shaping a narrative that highlights the key insights. It allows you to effectively communicate your analytics.
What is data storytelling?
So just what is data storytelling? It’s the process through which data analytics are turned into a narrative - either written or visual - that allows the insight to be more easily understood by the intended audience. It is the connector that merges much sought-after hard skills and expertise with the soft skills that encourage collaboration, knowledge sharing, and effective communication.

Through data storytelling, you turn your data analytics into a clear narrative, or storyline, that can communicate the key insights and context. This narrative can be augmented using visual representations (charts, graphs, diagrams, pictures, or videos) that help the audience to more clearly understand the key insights that you are presenting.
Why is this important? Because raw data is hard to understand and even harder to remember. Research carried out by Stanford professor Chip Heath highlighted the importance of data storytelling by showing that 63% of an audience could remember a story after a presentation, but only 5% could remember a single statistic.
If you want your data analytics to be understandable and memorable, then you have to shape it into a narrative through data storytelling.
But that gets us to the second problem. Most experts don’t find it easy to turn complex data into a relatable narrative and basic tools don’t allow you to easily turn your data analytics into a clear storyline. So how do you do it?
Like most problems, you need the right software. Toucan’s platform and embedded analytics feature makes it easy to shape that narrative and highlight key insights. So let’s take a closer look.
Data storytelling with Toucan
Everything so far might have made it sound as if you would require expertise and training to start changing how you communicate data in a more effective matter, but you don’t.
All you need is a dashboard that helps you easily identify key data and insights, an outlined methodology for shaping narratives, and the ability to share that information. With the Toucan dashboard, you’ll get all of that and more.
With the ability to connect Toucan to all of your other software and data sources via an API, you’ll be able to rely on a single source of truth. This greatly simplifies how you analyze data and ensures that different teams and team members all have access to the data that they need.
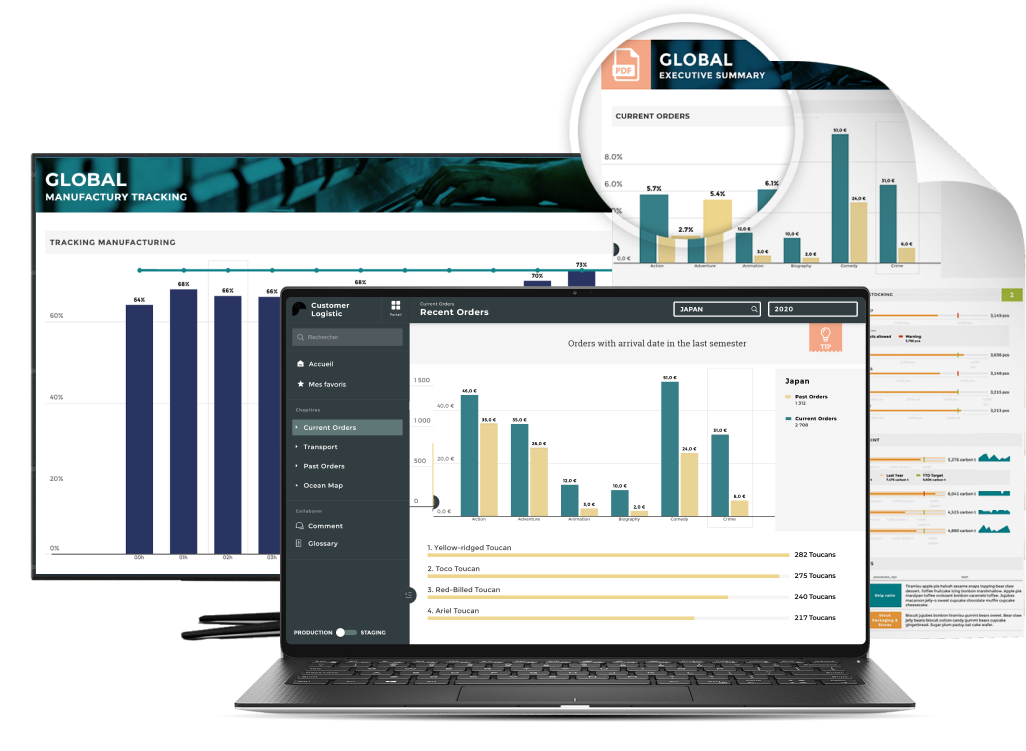
Toucan makes it simple to employ a data storytelling methodology by enabling you to create all of the graphs, charts, and visuals that you need from the same platform where you store, access, and analyze all of your data. It also becomes easier to collaborate on data analysis thanks to features that allow you to annotate and share from within the platform. Not only will these two features save time and make your teams more efficient, but they also significantly increase usage rates and engagement by not forcing you to switch software throughout the course of data analysis.

That ability is then further strengthened by Toucan’s unique ability to be integrated into other products. Embedded analytics can ensure that all of your organization, users, and clients can have full access to advanced analytics without having to leave your product.
But that’s enough with the sales pitch and the theoretical, let’s wrap things up with a real-world example that will help you to better understand the impact and effectiveness of data analytics within the Toucan dashboard.
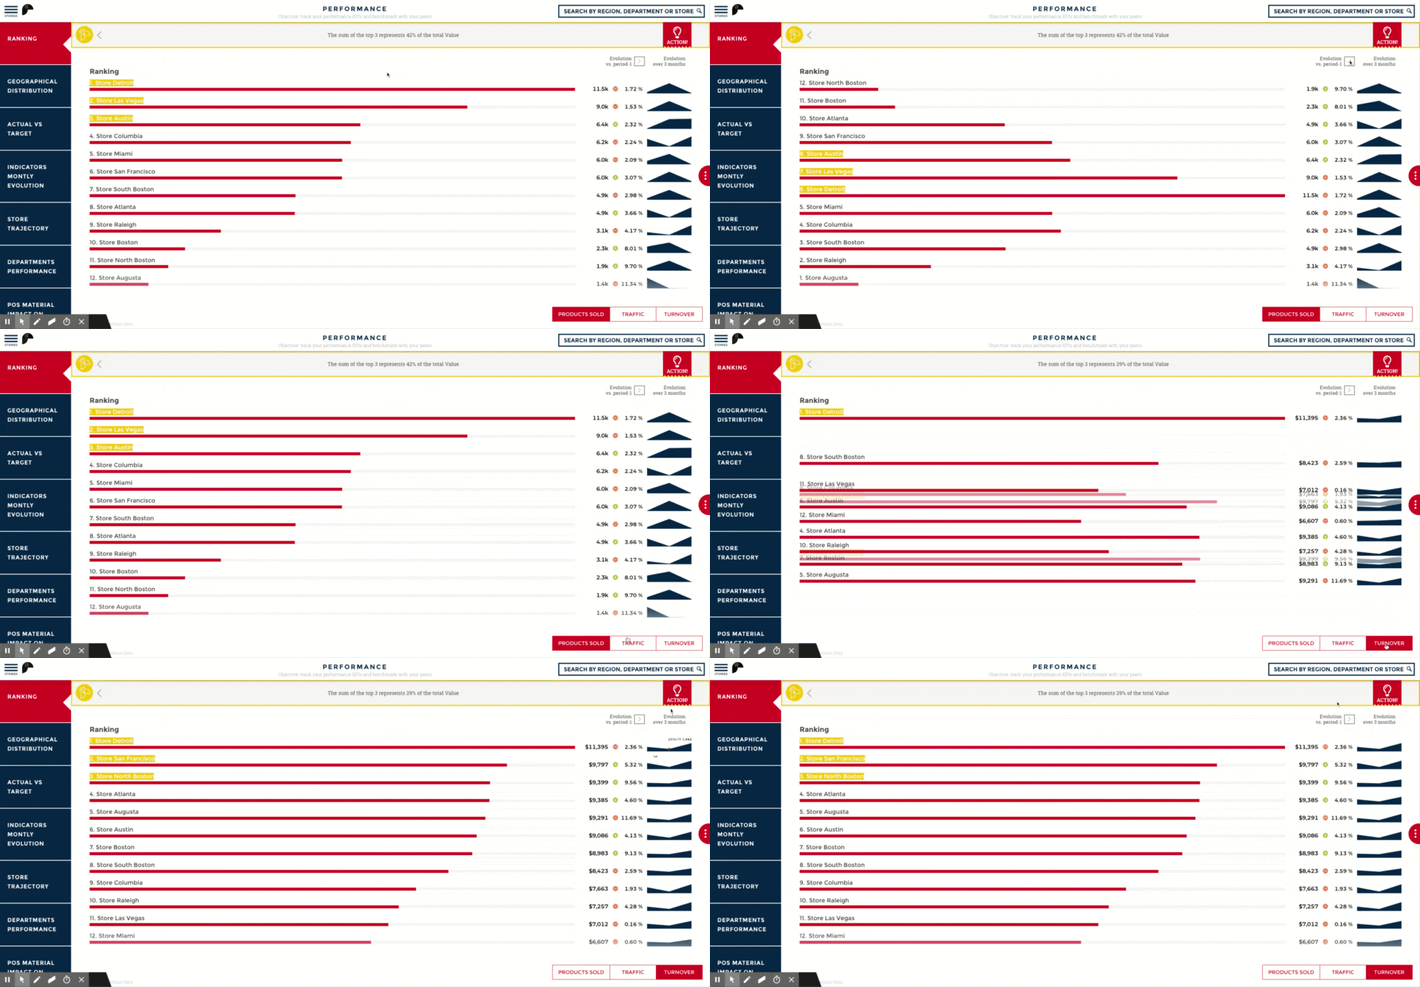
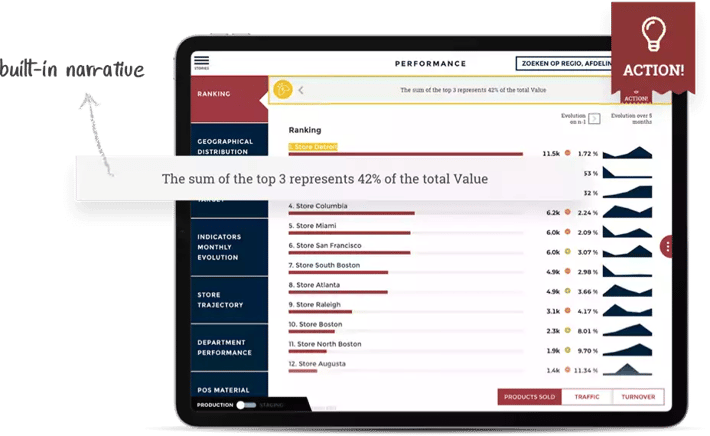
Toucan will help you to adopt a data storytelling approach. The Toucan narratives feature helps you to structure your data into clear levels that follow a story arc and make each of your key insights easier to follow. Let’s take this example:
- Level 1: Here you can see a downturn in this graph
- Level 2: This change represents a 22% decrease in our deal closure rate
- Level 3: 22% of our new leads are signing up from demos through a landing page for a feature that we no longer offer
- Action: We need to take down this landing page
Good data storytelling is all about making key business insights available across your organization. It can significantly improve collaboration and overall performance. The great thing about it? All you need is the right platform.
Toucan allows you to analyze large and complicated data sets, identify key business insights, and clearly communicate all of these insights to any audience — regardless of their expertise or prior contextual understanding.
You can schedule a demo to find out more about Toucan and how our platform can help your organization.


