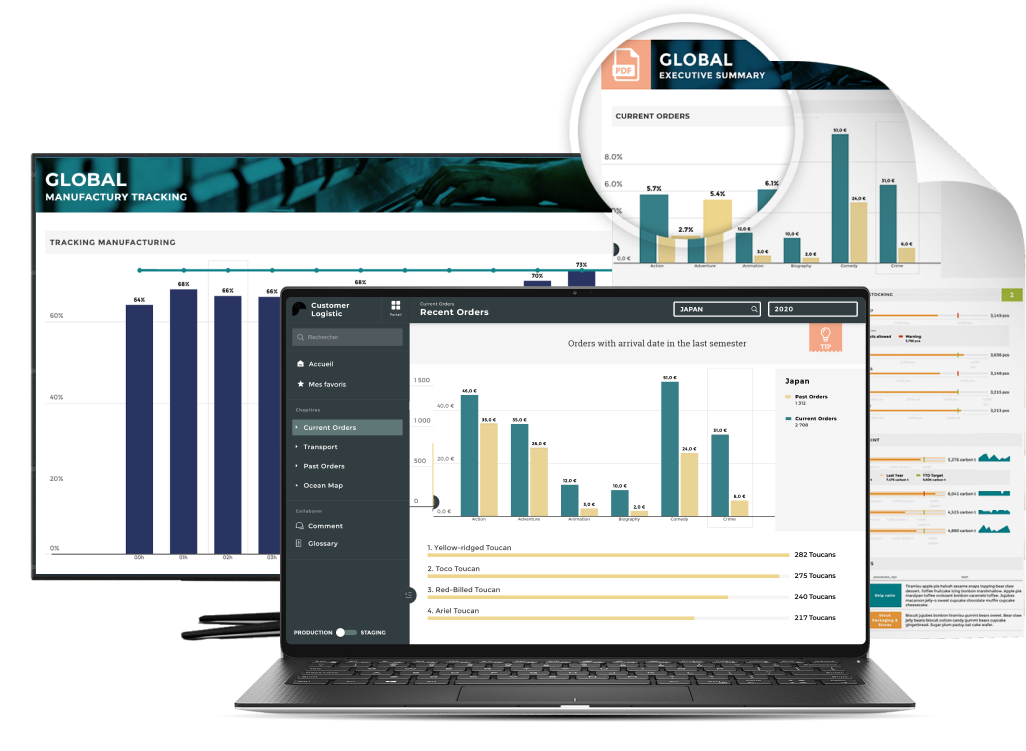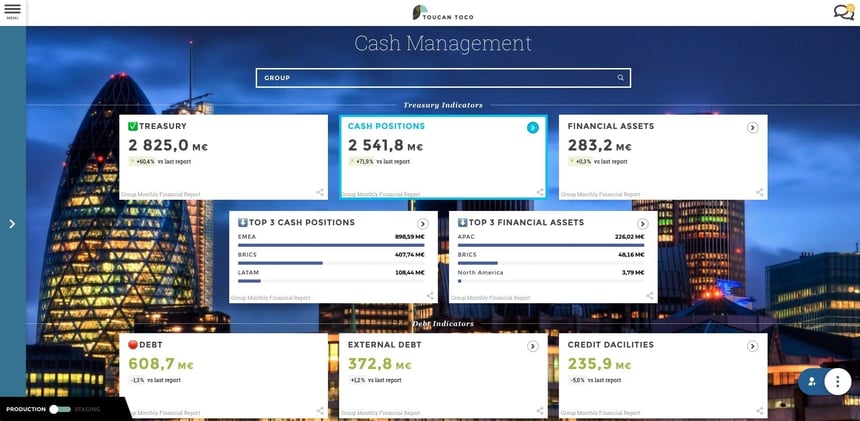
Financial dashboards assist you with keeping track of your business’s finances, especially the key performance indicator (KPI).
This tool will collect, store, and organize the data. As the data fluctuates, the dashboard will adjust with it but keep a record of previous information.
Financial dashboards are accessible to anyone, but they are built especially for those who can’t constantly review the information or who aren’t data specialists. Most dashboards will email PDFs and other information to you so you can meticulously track the details without having to constantly log into a portal.
During your journey, you’ll find that there are countless finance dashboards available. Some of these are:
- Cash management
- Profits and losses
- Accounts receivable and payable
- Financial performance
Benefits of Finance Dashboards
- Make More Money
Did you know that companies that switch to dashboard see a 6% increase in revenue within three months and have a 90% adoption rate? Therefore, if you want to take advantage of features like 3-click data searches, being able to get a complete picture of your company’s data within seconds, and being able to make some extra money, a dashboard is an excellent option to consider.
- Quick Financial Health Overview
Financial health and staying on top of how your business is doing with your money is a critical part of the job for any financial department. The use of a dashboard can quickly provide your team with an overview of the company’s financial health, and it will allow you to see how different items affect the big picture. This will save time otherwise previously spent pulling up records from different sources and compiling them into data reports that are very time-intensive.
- Observe & Mark Down Trends
A finance department dashboard can help you identify and read trends before they become problems. For example, suppose your company is experiencing a surge of spending on supplies this month. In that case, it might be time for the team to go over their purchasing policies again and ensure that they align with your monthly appropriated budget.
- Information at a Moment’s Notice
- Simplify Your Work
Nobody likes to work any harder than they have to do to get their job done well! A dashboard can help a finance team see what is going on with any given task without spending all day tracking down people or digging through files in different locations. In other words, a finance department dashboard will simplify business processes and make your life easier.
- Check Project Updates in Real-Time
A finance team should focus more on monitoring expenses and income as opposed to micromanaging their team. This will help the team to save time otherwise spent on meetings, emails, and in-person updates! A dashboard will allow you to easily see whether or not a task is on schedule, and it can help show who might need more support. Real-time updates that don’t lag behind for days and weeks help all team members and other departments to quickly check-in and gauge how your finance team’s projects are going.
- Gain Ground on Competitors
Strategy and pricing are crucial pieces of data that can help you stay competitive. A finance department dashboard will give you a clear picture of how your company is performing compared to other companies in the industry. You’ll be able to assess what you’re doing well, where your company needs improvement, and how it can compete with the competition.
- Prepare for Future Spending
If you got some big plans coming up, such as adding in a new franchise, you likely have some considerable financial planning to do! You’ll be able to see a real-time view of how your company is doing financially, which will help you prepare for any upcoming risks. If you are building a new franchise, for example, you can expect results such as a 5% increase in market share, a 3.5% increase in customer satisfaction, and a 7% increase in-store yield.

- Focus More on Your Job & Lesson Reports
Finance teams have long taken on the responsibility of accountants, which involves much time doing paperwork. Although previously this would be a very time-consuming task, a dashboard makes reports much easier. A finance department dashboard will allow you to spend less time on reporting. To do this, it provides you with tools for making your reports quicker and less of a hassle to handle.
- Make Sure You Follow Regulations
The worst nightmare of any professional team is to discover that they are breaking the law. A finance department dashboard can help your company stay compliant with regulations at all times, and it is a necessary tool for any growing business! If you want to increase your revenue, it is best to do so in a manner that keeps local laws into account!
- Available Online for All Departments
A finance department is often not the only one who will want to have access to a high amount of data such as what we find available using a dashboard. Instead, you will likely want to share this data across other branches of your company, such as the IT team, executive team, and so on! Thankfully, this is quickly done using a dashboard that stores data to a cloud and can be accessed on both computers and mobile devices!
How to Create a Finance Dashboard
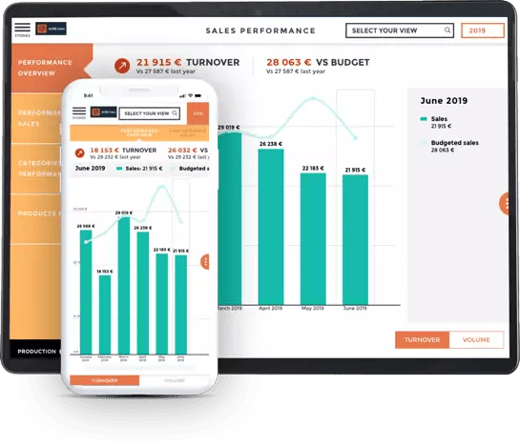
Making a finance dashboard can be time-consuming but it’s generally easy to do. Here are a few steps to guide you.
- Step 1: Collect Data
The first thing you’ll need to do is organize your data. This includes:
- Your current financial situation
- Your target audience
- Your intended cash flow and targets'
This can end up being a lot of information that could be difficult to chart on the dashboard. Before moving on to inputting the data, it’s vital to sort through and categorize it.
- Step 2: Consider Your Financial Goals
Once you’ve gone over your current information, you’ll want to spend some time thinking about the future.
Some things to contemplate include:
- Your value proposition
- Your ideal profit margins
- Service expenses
- Cash flow
- Future investments
With these, you can add your goals to the dashboard so it can direct you toward the right path.
- Step 3: Graph the Information
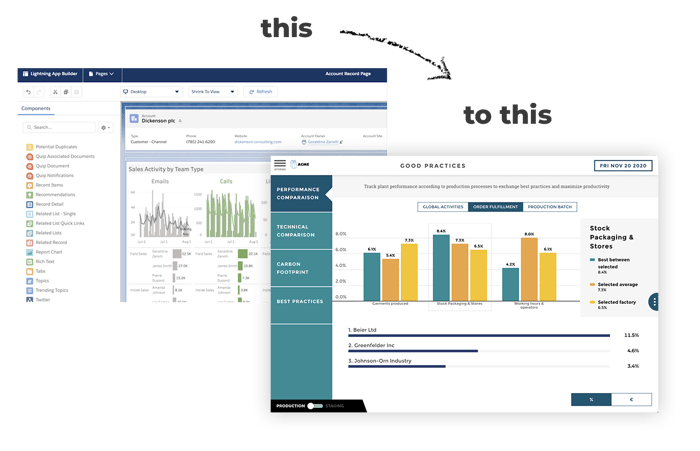
Once you’ve organized the information, it’s time to type it into the dashboard. The interface will usually have tabs that correspond to different aspects. You can click on them and then put the necessary information in. As you progress, you’ll notice the dashboard will start designing graphs and percentages based on the statistics. While it has a default color for the various portions, you can adjust the color scheme to fit your preferences.
Things to Keep in Mind
Financial dashboards are generally easy to use. But there are a few things to remember.
- Don’t Expect Immediate Perfection
While your financial dashboard will provide adequate information, be prepared to adjust it in the beginning. This is because the tool is still learning about your data and how to sort it. Yet, the dashboard will keep you updated on the changes so you can tweak it as necessary. Eventually, you’ll find this will give you more precise figures.
- Consistently Check It
- Don’t Overdo the Information
It might be tempting to store all your financial figures on the dashboard. While in some cases it could be necessary, often it only causes confusion. Sometimes, you might have irrelevant data that could make the actual numbers unclear. This could lead to you making poor financial choices.
To avoid this, only include relevant information in your dashboard. This ranges from current costs to profit margins. This way, your dashboard stays organized and you’re not inundated with unnecessary information.
- Make it Visual
You might not normally enjoy bright colors or graphs, but this is what helps your dashboard stand out. Often, these visual aids can assist you with finding information much faster than if it were just listed in black and white. Due to this, play around with colors, graphs, and the overall design. This way, you can quickly find what you need.
Important KPIs to Monitor
1. Total assets
A company’s assets can be defined as the money, goods, or property owned by a business. It could be cash on hand, investments like stocks and bonds, machinery, inventory, and so on.
Assets can also include intangible assets such as intellectual property: patents, trademarks, and copyrights. These types of assets don’t have any physical form, but they do still provide value. In any case, these are all great things to track in your dashboard.
- The Total Amount of Cash in Account
- Stocks, Bonds, and Other Investments
Knowing these items’ current value or worth will help you keep track of new developments and real-time decision opportunities, as these values change over time. It also informs your decision-making process when it comes to investing in future funds or projects.
- Property Value & Information
Property is another asset that you should track. This can include office buildings, industrial facilities, and even vehicles like cars or trucks. Of course, this information is crucial for companies who own their buildings instead of renting.
- Inventory Value
If your company sells goods, then they will need inventory to sell them with! Never again will you forget about small inventory items with a dashboard! Tracking the value of these assets ensures that you know how much you can sell and for what profit.
- Intangible Assets Value & Information
The value of intangible assets will vary but are worth tracking nonetheless. Intellectual property like patents, trademarks, or copyrights will need to be tracked so that they don’t go unpaid.'
2. Net Income
Perhaps the most essential component in your dashboard is the net income. This is the income earned by a company after all expenses have been subtracted from revenue. Understanding how much money your business makes can help inform decisions about expanding or cutting back, investing in other opportunities, and much more! Of course, you will also need to track all your expenses data to track net income.
3. Profit Margin
Gross profit margin is the amount of profit the company is making based on how much it sold. When you have access to this information, you can better determine how well the company is doing at any given time. In addition to gross margins, other types of profit margins might need to be tracked.
- Operating Profit Margin
This is the amount of profit that a company made on its ongoing operations.
- Net Profit Margin
Net profit margin is calculated by dividing a company’s net income by revenue.
4. Shareholder Equity
Shareholder equity measures the value that a company has between its assets and liabilities on paper. You want to make sure you have an accurate representation because it will allow you to compare with other companies in your industry for benchmarking purposes.
Other company executives might also like to hear about shareholder equity when they are considering investing in your company. Therefore, your job as a finance team should be to secure all of this information in an easy-to-read manner that can be easily shared and accessed when necessary!
5. Debt, Loan, and Investment Data
Knowing your current debt ratio is essential as a finance department team since it will tell you how much of the company’s assets are being used for debt payments. When you have access to this information in real-time, you can reduce or increase debt without feeling that you are recklessly spending.
- The Current Status of All Loans
In addition to the current debt ratio, you should have specifics on the current loans you have taken out. You should have information such as exact balances, how many payments are left, what the monthly payments will be, and how they all align with your department’s budget.
- Scheduled Projects & Their Budgets
The finance team is the glue that holds your whole company together and keeps it healthy! As you continue to grow, you will inevitably have lots of new projects to tackle. Of course, they will also come along with a budget. Keep project status and budgets handy on your finance department dashboard. This will help you better understand what your resources are and how much they can handle at any given time.
6. Return on Investment (ROI) Data
An ROI is an important metric to keep track of for your company’s finance department dashboard. It calculates profit relative to cost or investment, and it lets you know how well your investments are doing overtime. It can be challenging for some companies who invest in their own product line to find an accurate ROI regularly because they don’t have access to this information as often as other companies.
- The ROI of Current Investments
To measure your current ROIs accurately, you will also need access to how much was invested and whether or not the investment was successful. Typically, you might not quite have an ROI when tracking current investments.
- The ROI of Past Investments
You should also have access to an accurate representation of how your past investments are doing. You can compare and see any correlation between those numbers and what has been getting spent in terms of current investments. This will allow you to take steps rationally using previous experiences.


