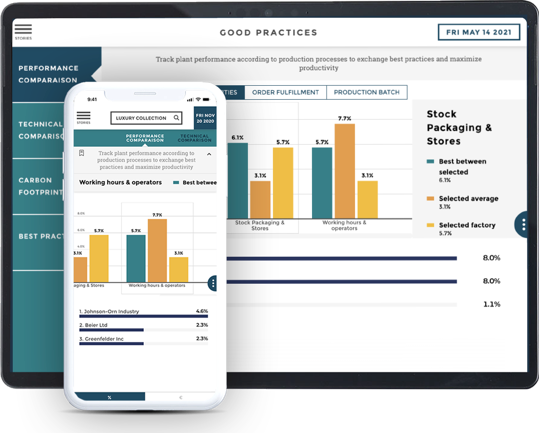
Let's go back to the 1990s. The term "business intelligence" became hot in the enterprise world as every company looked to modernize and pinpoint its weaknesses. Firms would store their data on servers and although they offered executives insights, these tools were extremely limited.
Data took another turn after the 2000s, with hard drive technology catching up to the growing amount of data collected by firms. Many innovators in the data space were dreaming of a day when data could be stored wirelessly and accessed via internet connection.
Cloud computing was a primitive concept in 1999, but Salesforce demonstrated that the technology was indeed possible. Each year, cloud technology continued to develop and evolve, but the data journey is not simple, especially for decision-makers.
In 2022, cloud computing is reaching its ceiling. Professionals can access their data anywhere and at any time. Tools like Snowflake, BigQuery, and AWS Redshift allow firms to store terabytes of data in the cloud and connect data sets to applications. Seems like everything would be quite simple if you were an executive looking to dip your toes in the data analytics market.
Unfortunately, the exact opposite was true. Executives were pleased with their data richness, storing terabytes of data. What they lacked, however, was the ability to use and process that data into predictive trends and actionable insights. Executives are ultimately result-oriented, and the technology was simply not providing worthy returns.
Until now.
If you look hard enough, dashboards are everywhere. Whether it's behind the counter at a Starbucks, or at any warehouse in the country, employees and employers are viewing the same data. Data visualization has finally caught up with the needs of decision-makers, and the exponential growth and adoption of visualization tools prove that data is only valuable when you can use it.
It is possible to run a successful business without tracking data concerning every department, consumer, and product. Executives are on notice, and most of the most successful companies have built tens, if not hundreds of dashboards for their executives.
Data Storytelling For Executives
The main driver of insights for decision-makers stems from the benefits offered by data storytelling. Although some executives still prefer to use tables, (link to tables article) the addition of visualization in data analytics has been a welcomed innovation.
In case you're not familiar, data storytelling uses stored data to create a personalized story of your KPIs. Whether you're a CFO who wants to see a story of their balance sheet, or a CEO who needs a big picture of their business. Whatever your use case, a story of your data can make a big difference when it matters.
The adoption of data solutions is still a pain point for companies trying to make use of their data. To learn about how data storytelling makes it easier for executives and employees to make sense of their data without technical knowledge, read our article explaining the phenomenon.
Executive Dashboard Examples
Although decision-makers share a lot in common, the data each department collects is different and makes up an important piece of the puzzle. A one-size fits all approach will not work when crafting a dashboard for a firm's executives. We'll break down each department of C-suite executives and provide a dashboard example for each.
CEO Dashboard
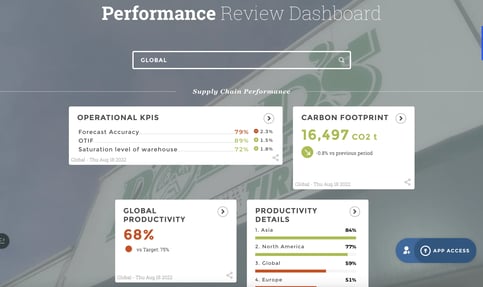
When someone hears the acronym "CEO," they are instantly interested. That's not a surprise, CEOs steer the company ship and take responsibility for coordinating all areas of the business.
Because CEOs have so much on their plate and are usually always on the move, having a dashboard built for a snapshot overview of the company's financial and operational health can greatly benefit a firm's growth. Read our dedicated piece on the topic to learn more about the KPIs and considerations to keep in mind when building a CEO dashboard. (Link to building CEO dashboard article).
CFO Dashboard
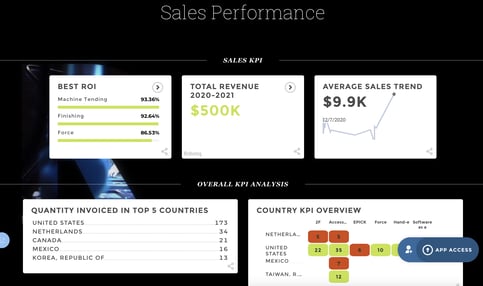
CFOs stand to benefit from data visualization. As we head into a forecasted recession, CFOs are drawing on more data than ever to predict long-term trends and avoid financial troubles. Finance executives are making more use of financial dashboards than ever, with 81% of finance professionals stating that data storytelling is an essential skill for finance professionals.
Because the finance world is changing at the fastest pace in human history, having a dashboard of a CFOs most important metrics that update in real-time can bring in tangible returns. If you want to learn more about incorporating data storytelling in your CFO dashboards, read to learn more. (Link CFO Data Storytelling article)
COO Dashboard
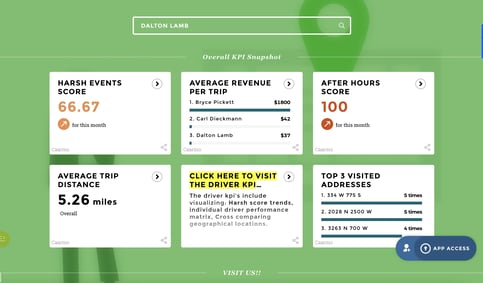
COOs arguably are the most in need of dashboards to track their organization's operational efficiency. Because data visualization tools like Toucan update KPI metrics in real-time, COOs can keep a constant watch for negative trends.
We'll take the logistics industry as an example for this dashboard. With many employees in the field facilitating deliveries, real-time data can convey their efficiency and customer satisfaction to the COO. The example KPIs we included in the example are:
- Fleet Efficiency
- Delivery Status
- Deliveries by Destination
- Loading Time & Weight
These aspects are crucial to a COO of a logistics business, as they determine the reputation of the firm as a reliable logistics provider. Because COOs operate in industries with different operational KPIs, it is important to narrow down the most important metrics to track operational efficiency. (Link to Dashboard Prototyping article).
CMO Dashboard
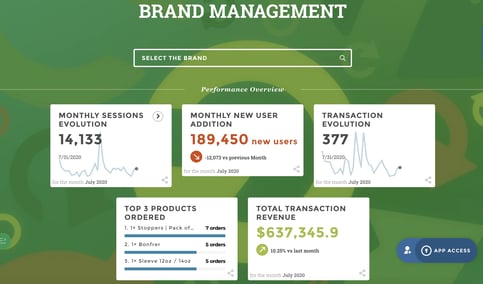
Marketing has undergone an evolution in the past decade. With the internet generating an explosion in advertising, marketing is now a science. CMOs must now keep track of SEO data, lead conversions, advertising budgets, churn, and others. Learn more about the most important KPIs for a CMO to track here.
In this example of our CMO dashboard, we included the following KPIs:
- Conversion rate
- Customer acquisition cost
- Revenue
- Marketing ROI
CMOs must track many more KPIs to have a clear image of marketing operations. As for many of these executives, we advise creating multiple dashboards that group KPIs categorically to decrease the possibility of confusion and data headaches.
CIO/CTO Dashboard
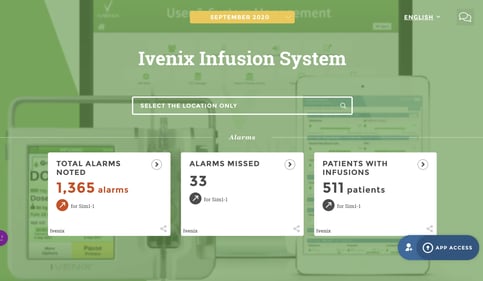
Let's talk about the executives who are making the decisions to expand or reduce their data stacks, the CIOs. As experts, CIOs must track the current performance of their tech stacks to optimize performance. Constructing a dashboard that allows CIOs to view negative trends in technology investments can save resources and allow for investment into a better-performing tool.
In our CIO dashboard, we included the following KPIs:
- Security incidents
- System uptime/downtime
- Hardware usage as a percentage of capacity
- Application response times
- Network traffic
Depending on a firm's technology budget, you may want to construct separate dashboards for its cybersecurity division, or even build dashboards to evaluate the performance of your most expensive investments. By using a data visualization tool to evaluate the tools in a firm's data stack, CIOs can make an informed decision to either continue with an effective tool or axe underperforming solutions.
The Executive Dashboard Solution
Using an executive dashboard can provide leaders in any department with actionable insights that have the power to transform a business. New generation tools like Toucan can provide a seamless dashboard building platform without the headache of a steep learning curve and data education.
Toucan’s embedded analytics works to cater to specific use cases for several industries and departments, carefully tailoring its applications to the requests and needs of a client. With rapid app deployment, Toucan’s real-time KPI tracking is extremely useful for business leaders looking to keep constant tabs on financial health. Mobile optimization also caters to busy executives on the move and simplifies complex data sets to tell a firm’s data story.
Mobile analytics is the future of insights on the go, and executives stand to benefit the most from its capabilities.


