Financial reporting is often thought of as the sole concern for accountants and finance professionals. Although their business insights impact virtually every area of an organization, the data, information, and analytics themselves are often siloed and only accessible to a wider audience through the reports themselves.
In large parts, this is because the information that we associate with financial reporting is often limited to annual reports, budgets, forecasts, and general ledgers. The reality is that CFO analytics now stretch far beyond these areas.
In fact, McKinsey research shows that 41% of a finance department’s analytics is associated with non-finance related topics. A white paper published in the Harvard Business Review also predicts that a financial and accounting department’s ‘ability to continue to increase its value contributionwill depend on its ability to make use of advanced analytics’.
So how can accountants and finance professionals adapt and thrive whilst their responsibilities can continue to grow? And how can they effectively communicate important data and information to other departments in the most efficient way possible?
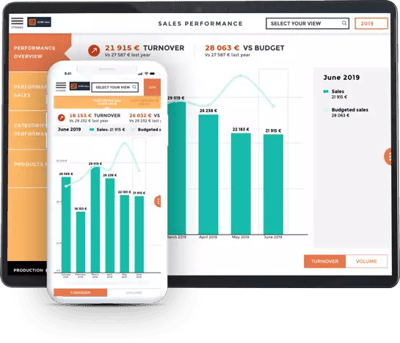
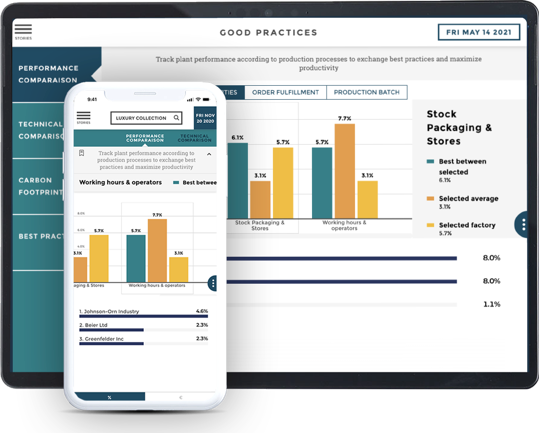
The answer? CFO Analytics and a CFO Dashboard that takes them beyond spreadsheet management and allows them to harness the power of their analytics through data storytelling. The dashboard allows users to manage data in real-time and turn it into a narrative that is both compelling and understandable for the intended audience.
This last point is key. There’s no doubting the importance of the information handled by your accounting and finance departments, and good data storytelling will ensure that the message is understood by every other department within your organization.
Improving financial reports through data storytelling
Good data storytelling makes information easily understandable and memorable for a wider audience. It is the process through which data analytics are turned into a clear narrative - either in written or visual form - and it makes large data sets much easier to process. It’s a structured approach to relaying information that comprises three key elements: data, visuals, and narrative.
When it comes to financial reporting, the ability to make data more engaging and memorable is particularly important. Data storytelling can help your audience to both understand and remember the information that you are sharing.
A study performed by Stanford professor Chip Heath showed that 63% of an audience could remember a story after a presentation, but only 5% could remember a single statistic. This has huge implications for accountants and finance professionals who are sharing data and analytics that are often both complex and unfamiliar to much of their audience.
It’s important that finance and accounting consider exactly how their information is most relevant and impactful to different departments and good data storytelling, CFO analytics, and a CFO dashboard can help them to go beyond a spreadsheet and make the most of their data.
CFO Dashboard: more than just spreadsheets
CFO Analytics allows organizations to leverage advanced analytics, identify meaningful business insights, and develop a better vision and understanding of their overall business.
This form of advanced analytical is actually representative of another change in how financial reporting is now viewed, with research by Accenture showing that ‘developing the data and insights that are focused onwhere the organization should go, rather than where it has been’.
Finance and accounting have traditionally been reliant on excel spreadsheets, but in order to manage an increasing amount of data and data sources, they need access to better and more powerful tools. That’s where the CFO Dashboard can come into play.
This isn’t to say that spreadsheets themselves are now outdated or unusable, it’s simply acknowledging their limitations. Spreadsheets are great for inputting and storing large data sets, but they rely on manual tasks, are not suited to automation or collaboration, cannot show historical data, and, most importantly, are not a reporting tool.
So it may remain the best tool in certain situations, but its limitations mean that it can no longer be the go-to data management software for your finance and accounting departments. Not only does it make their tasks more difficult, but it can make it virtually impossible to share vital information with a larger audience.
We’ve all been in situations where colleagues have shared crucial information with us via spreadsheets and some charts. The information itself is great, but identifying the value and business insights is a challenge for anyone - especially for those who are not intimately familiar with the data itself.
The CFO Dashboard solves this problem by not only storing all of your data in a single platform, but by allowing you to present it in a format that is suitable for each of your audiences. Your finance and accounting department might still want to see spreadsheets, but there’s a good chance that your board, executives, and different departments will respond better to a different format.

Accessible financial reporting
The tangible benefits of the CFO Dashboard are not hard to see. To start things off, storing all of your financial analytics on a single platform makes managing your data much easier. It also allows users to easily select the most relevant metrics and KPIs, look through historical data, and make financial forecasts.
The dashboard also makes monitoring financial performance much easier by allowing you to customize your alerts and indicators. Whether you're putting together a budget or preparing an annual report, the ability to access all of this information from a single source and present it in different formats greatly reduces the preparation time - allowing you to dedicate more time to the content itself.
The dashboard adds even more value when it comes to presenting financial analytics to new audiences. Whether that be your board of directors, senior executives, or other teams within your organization, the dashboard allows users to easily access relevant information whenever they need to and view it in a format that is the most meaningful.
That means that board members can spend less time trying to understand the data and more time discussing it. That your executives can access key financial information whenever they need to. And that other departments within your organization can understand exactly what the next budget will mean for them and what the latest financial report means for the future of the company.
Start using our CFO Dashboard
Toucan’s CFO Dashboard allows you to monitor every aspect of your organization’s financial performance. Regardless of the industry, the financial dashboard can be customized to your needs and automated to simplify your financial reporting.
By selecting the most relevant KPIs, metrics, and data, you’ll be able to have an up-to-date view on your financial performance from a single platform. You’ll also be able to easily present this information in the most relevant and meaningful format to any audience.
Schedule a demo so that you can see how Toucan’s CFO Dashboard can help you to improve your financial reporting.


