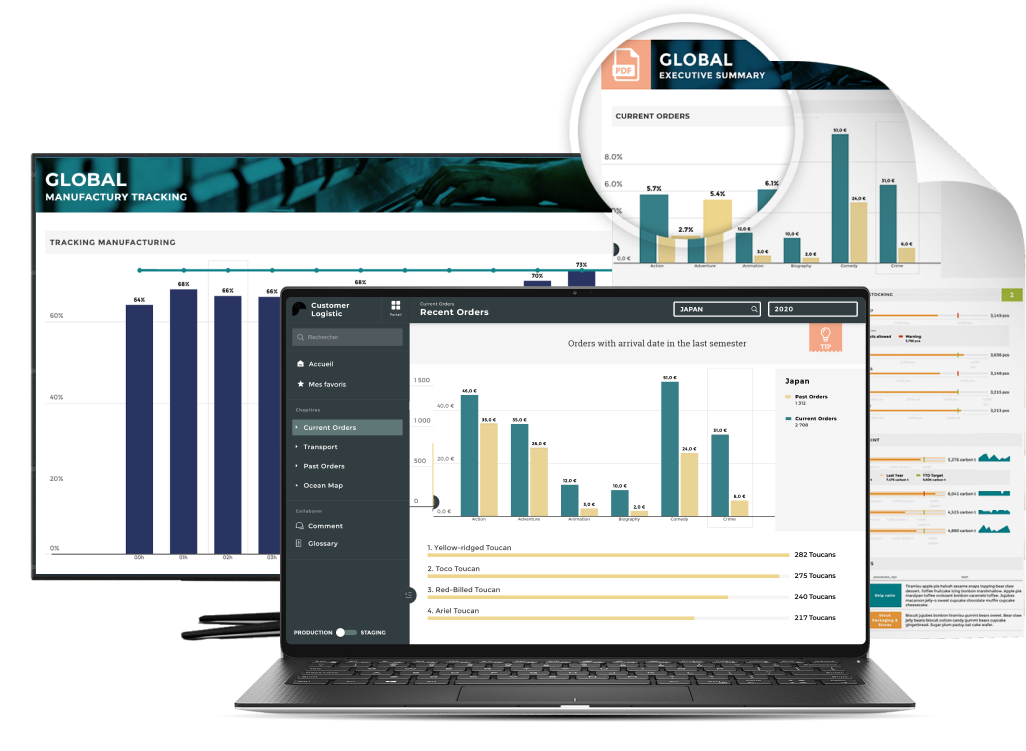
The responsibility of managing lots of data and information - all at once - is a requirement for most SaaS companies with a number of clients or agencies. In order to ensure profitability and sustainable development, you need to help your clients get the best results possible. This can be done in one simple way, by helping them manage cash flow and budget. The introduction of accounting dashboards and reports that engage your clients may be the solution you are looking for.
Client accounting dashboards are modern management tools used by SaaS companies, agencies, resellers, and customers in order to help clients visualize data interactively and make data-driven decisions derived from various data sources to produce dynamic reports and increase productivity.
Managing each client requires you to adhere to their brand guidelines, automate as many aspects of their data as possible, and at the same time provide them with in-depth information about their business in a visual format, customized according to their specific requirements. In order to present the dashboard as your own, you need a customer-facing analytics solution that includes white-label options. In this way, no client will be able to distinguish that a third party is proving the analytics functionality and you can increase the value of your offering.
Here are the different types of accounting dashboards you could include to engage your clients.
Forecast dashboard
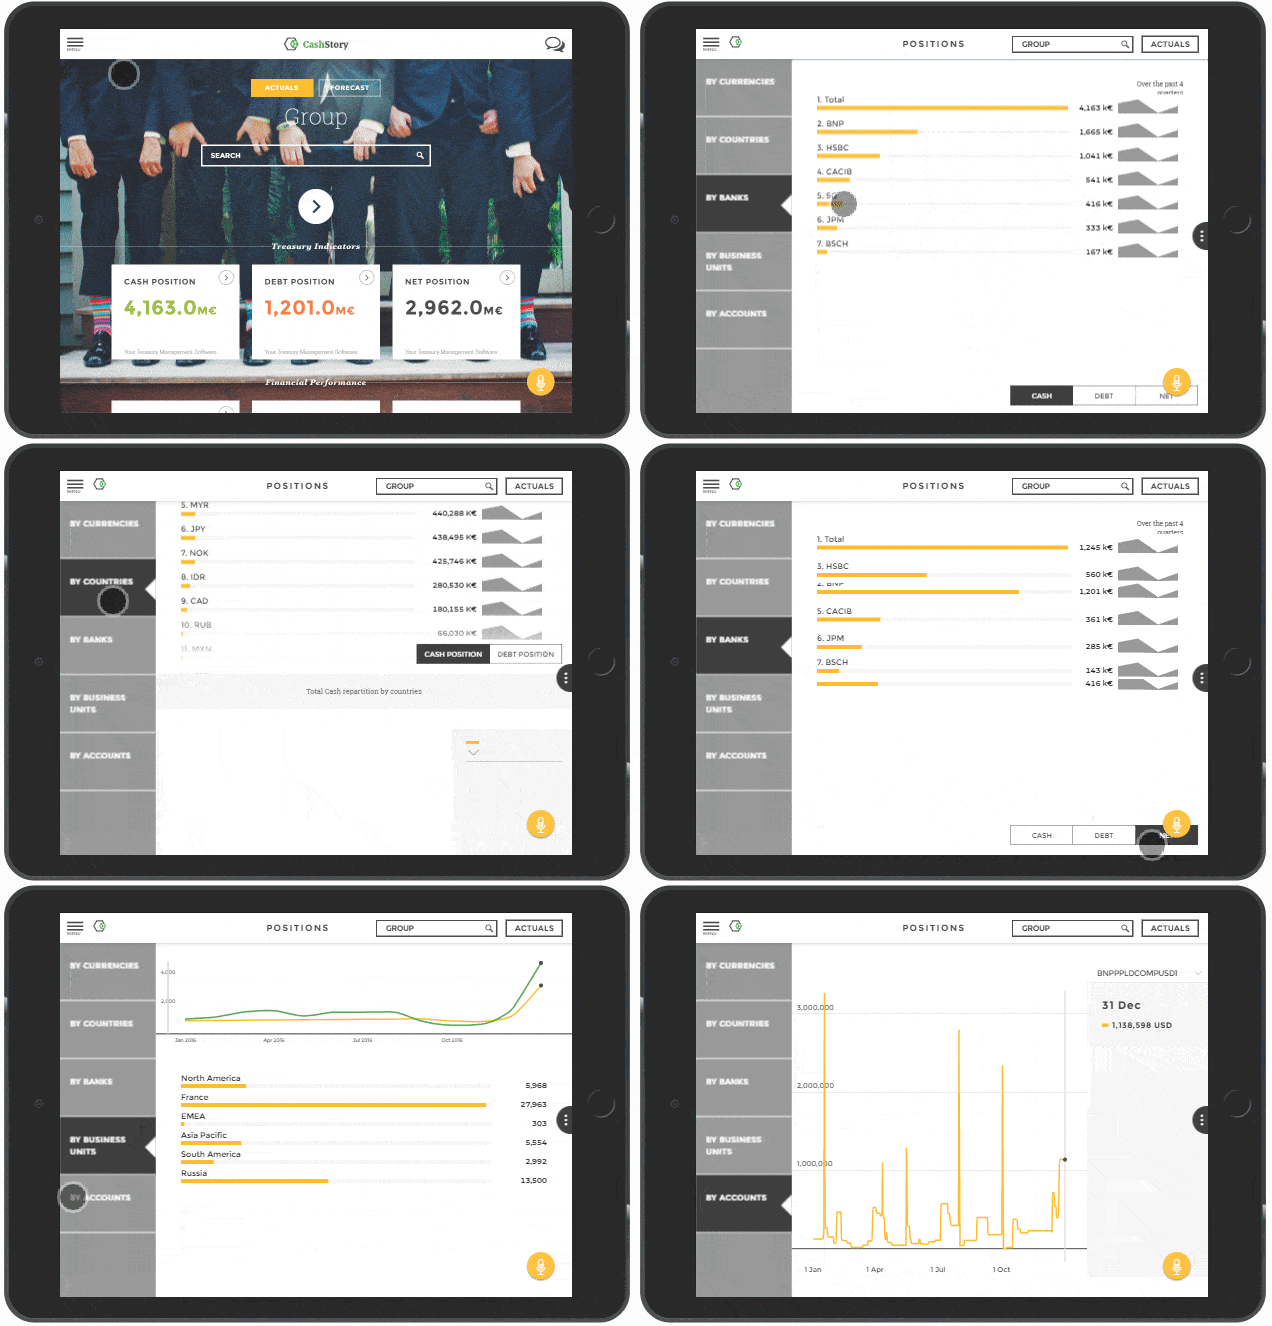
The CFO uses the forecasting dashboard for determining how individual teams (located in different states) perform against budgeted revenue projections. It is a great way to understand the overall financial health of the company by comparing budget to spend. This can help direct the future strategy your clients will have to take to ensure growth and success.
In addition, CFOs can see how the revenue is tracking against the forecast. The forecast is created at the beginning of the financial year and is normally updated every quarter. The creation of a realistic forecast will allow your clients to better understand whether they are ahead of or behind budget at that time of year.
Using Toucan, the CFO can also track the performance of individual teams in different states, regions or countries depending on the needs of your client. Teams that are likely to miss their target for the year are flagged using a color-coded system. This way you can understand a team's performance in one glance. Lastly, clients can also view all teams' current revenue performance as a percentage of their target revenue.
- Areas of focus:
Revenue vs forecast, team performance, budget risk - Users in the client’s company:
CFO, Finance Director - Frequency of use:
Several times a month
Revenue Dashboard
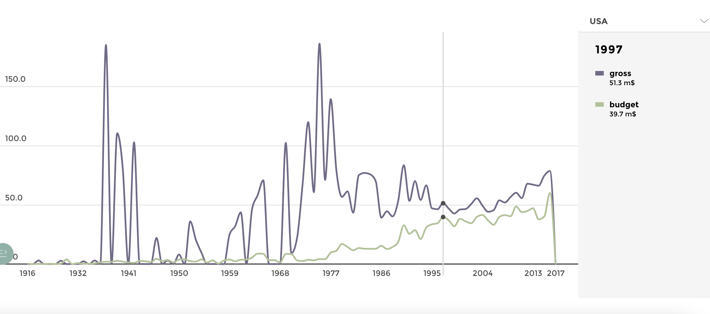
Revenue dashboards provide users with a clearer picture of how the company's revenue is being affected by various factors.
Revenue dashboards can help clients track all forms of revenue including MRR (Monthly Recurring Revenue), which is a measure that many subscription-based businesses use to provide a normalized, high-level picture of their revenue performance. Toucan dashboards come equipped with a glossary section to help non-technical clients better understand the terminologies used in the charts and dashboards. Further context can be provided with tips and a description.
Revenue changes can be attributed to a number of factors, especially in SaaS companies. Among these activities are the acquisition of new customers, cancellations, upgrades to higher-priced plans, downgrades to lower-priced plans, and the reactivation of dormant customers. In addition to showing the Net revenue changes, this type of client accounting dashboard also shows each of these metrics separately so that clients can understand the context of the changes to the primary KPI.
- Areas of focus:
Net revenue, MRR, revenue change - Users in the client’s company:
Head of Sales, Finance Director, C-suite - Frequency of use:
Several times a month
Cash flow dashboard
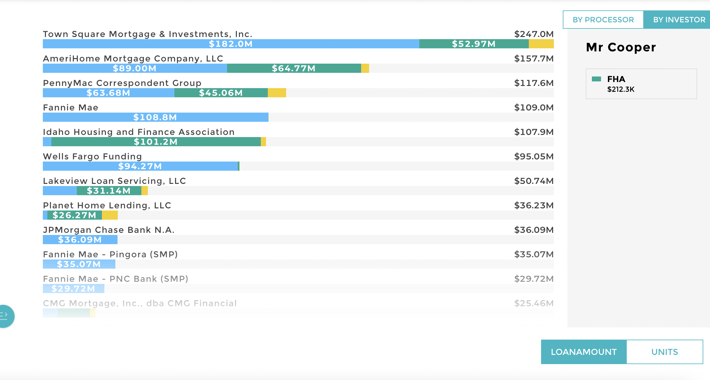
A cash flow dashboard monitors the immediate spending power and cash flow of a company. As revenue models don't always reflect a company's immediate cash position, C-suite, accounting and finance directors must track cash flow separately from revenue.
There are several metrics related to cash flow that are tracked in this type of client accounting dashboard. There are three main metrics that most clients want to track. First is the total amount of cash in the bank and how it has changed over the past month. Second is the Burn Rate, which refers to the difference in cash month-to-month. Lastly, we have Cash Runway, which shows how long the company can maintain its current Burn Rate. Additionally, the cashflow dashboard has broken expenses down by type so that clients can better understand how expenses are incurred. Check out more cash flow KPIs that are important for the overall health of your clients.
Debtors should occupy a significant portion of the cash flow dashboard. The presence of debtors isn't necessarily a bad thing, and it's common in industries that issue invoices. Toucan dashboards include alerts and indicators that show whether unpaid debts have been unpaid for more than a specific period of time. This helps clients immediately identify debtor issues before they have a significant impact on the company.
- Areas of focus:
Cash Runway, Burn Rate, debtors - Users in the client’s company:
Accountants, CFO, CEO - Frequency of use:
Every week
Sales Manager dashboard
In order for Sales Managers to be effective in their role, they need a complete overview of their metrics. A sales manager dashboard's content can vary depending on which company the user works for or what product or service they sell. These types of client accounting dashboards typically reflect the fact that Sales Managers handle a variety of responsibilities, including managing teams and achieving revenue targets.
Different examples of Sales Manager dashboard
- Monthly Sales KPI Dashboard
- Sales Team Overview Dashboard
Monthly Sales KPI Dashboard
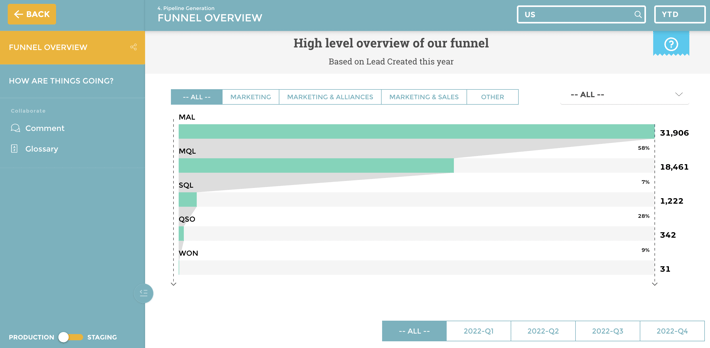
The purpose of this dashboard is to provide an overview of the Sales Manager's progress toward their monthly revenue target and other important sales KPIs. The performance of the sales team can be tracked quickly, including the number of deals that have been closed so far. Additionally, the dashboard displays the total value of the immediate pipeline, including the accounts that are included in the pipeline. By doing so, sales managers are able to determine the likelihood of meeting their monthly targets, or if they will need to take a different approach. Additionally, the dashboard displays revenue figures from previous months, as well as color-coded indicators for months in which the target was met.
- Areas of focus:
Monthly targets, immediate sales pipeline - Users in the client’s company:
Sales Manager, Sales Director, CEO, Sales Team - Frequency of use:
Several times a month
Sales Team Overview Dashboard
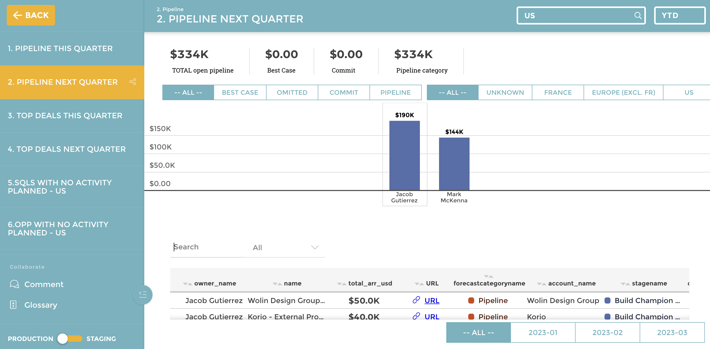
The objective of this dashboard is to assist sales managers in managing and supporting their direct reports. Sales managers can easily identify issues and provide extra support when necessary based on a clear overview of how individuals are progressing toward their targets. Additionally, this dashboard displays secondary metrics such as conversion rate and average order value. To make the process more efficient, toucan comes with an inbuilt comments section. This way sales managers can discuss ongoing issues, give feedback or understand the reason for a team member's performance all without leaving the application.
- Areas of focus:
Team performance, areas for improvement - Users in the client’s company:
Sales Manager, Sales Team - Frequency of use:
At least once a week
E-commerce dashboard
Optimizing every stage of the customer journey is key to a successful e-commerce business. Online sellers can track their progress and respond to changes quickly with e-commerce dashboards that aggregate the most important performance metrics.
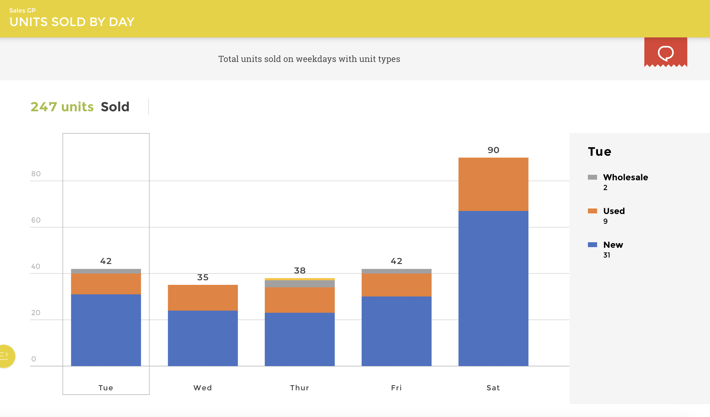
Toucan's e-commerce dashboards can connect to any data source with just 1-click and provide clients with the most up-to-date e-commerce metrics using live data. This client accounting dashboard tracks important seller metrics such as total revenue and orders, along with health metrics such as Average Order Value, and Profit Margin.
E-commerce dashboards also include a Profit & Loss statement, detailing various business costs incurred last month. These metrics are not tracked in Shopify or other e-commerce platforms. But by using an embedded analytics dashboard, they can display these important metrics alongside the Shopify data, even though they come from different sources.
- Areas of focus:
Revenue, orders, business health - Users in the client’s company:
Accounting team, CEO, Sales director - Frequency of use:
Every day


