Hospitality might be a dynamic industry, but it isn’t impossible to predict future opportunities and prepare accordingly.
The digitalization of the hospitality sector means that your typical customer will interact with a variety of digital touch points while planning, making reservations, or enjoying your services.
And at every touchpoint, they generate data, signaling what lies ahead.
Today's hospitality managers must be able to manage and read data, such as hotel KPIs, effectively to be able to make accurate forecasts and optimize their operations.
Fortunately, historical data and new sophisticated hospitality analytics can be used to help them do just that.
Intelligently sourced and processed data insights can help hospitality leaders adopt data-driven decision-making and achieve as much as a 55% competitive edge over their peers.
But how do you sift good, relevant data from all the “noise” that's generated day after day? After all, the GIGO principle (garbage in, garbage out, i.e., poor quality data inputs or an overly broad dataset will yield equally poor results) certainly applies to the hospitality industry.
It’s therefore only by tracking the specific KPIs that are most relevant to a line manager’s business that actionable insights can be obtained.
At Toucan, we work with some of the world’s major hospitality chains such as Elior, Sodexo and Eden. That's why we wanted to share some of the key performance indicators (KPIs) that proved to be game-changers for their success.
Which hotel KPIs should you monitor?
1. GOP (Gross operating profit)
GOP or Gross Operating Profit is an excellent indicator of business health for a particular period.
The formula for calculating GOP is as follows:
Gross Operating Revenue – Gross Operating Expense = GOP
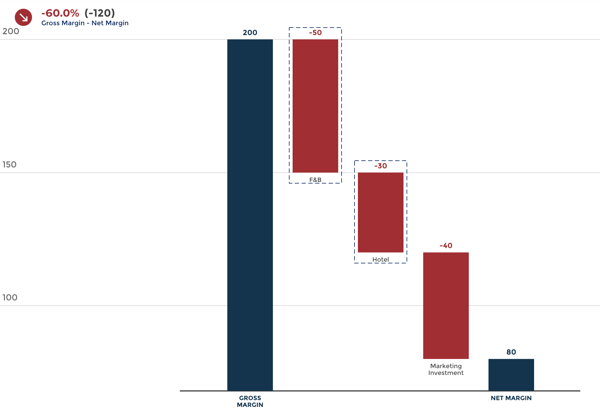
In and of itself, GOP can sometimes be too broad of a KPI to act on, which is why you should make sure that you have a GOP drill-down, if appropriate, for each of your hotels’ different functions.
Hospitality managers should keep an eye on GOP for food & beverages (F&B) services, hotel spaces (accommodation & events), marketing, distribution, and so on.
An important sub-KPI to be aware of here is GOPAR (Gross Operating Profit Per Available Room). GOPAR lends visibility into the value of a given room at any given time, and considers each room as an individual asset.
To summarize, measuring GOP can ultimately help to:
- Reduce expenses from crossing revenue
- Ensure sustainable margins
- Monitor loss period(s) and better plan for profitability during rebounds
- Better understand investment leakages and offset with other revenue sources

2. ADR (Average Daily Rate)
ADR, or Average Daily Rate, is a more granular KPI that pertains solely to accommodation.
ADR measures the average revenue you earn by renting out a room for occupancy in a single day.
If you multiply ADR by your occupancy rate, you get the total revenue per available room.
The formula for ADR is as follows:
ADR = total room revenue earned in a day ÷ the number of occupied rooms
This KPI has several benefits, and helps to:
- Indicate true accommodation profitability when room occupancy is low
- Alert hoteliers about unsustainable room rates
- Highlight low occupancy, which could be leading to investment leakage

3. RevPar
RevPar, otherwise known as revenue per available room, is closely linked to ADR.
You can calculate RevPar by using the following formula:
ADR x room occupancy rate = RevPar
RevPar is an essential KPI as it informs you as to how much of your GOP is generated by accommodation. After all, the hotel business is a combination of two assets – real estate and operations – and RevPar shines a light on the profitability of the first element.
By measuring RevPar regularly, you can:
- Plan for room repartitions to optimize occupancy
- Make smarter decisions around long-term property investment
- Compare RevPar across sites to offer the best mix of services
4. Occupancy rate
This simple but handy metric tells you how popular your hotel really is, as it is a strong indicator of customer sentiment.
A high occupancy rate generally means your room inventory is well-matched with market demand. It also means that you have no sunk costs. The formula for calculating your occupancy rate looks something like this:
(Number of occupied rooms ÷ the total number of rooms in a property) x 100 = Occupancy rate
Guided by this KPI, you can:
- Compare multiple sites to flag low occupancy rates and analyze root cause
- Invest in non-accommodation services to tide over a period of low occupancy
- Tweak promotions and offers to improve room occupancy
5. CPOR
CPOR, or Cost Per Occupied Room, measures how much you’re actually investing on a per-room level – covering tangibles such as linen, power, plumbing, etc., as well as service level costs.
CPOR can be used in conjunction with other hotel KPIs, like RevPar, to compare and contrast your expenses with a room’s profitability.
In other words, CPOR shows how well you are able to optimize each room’s real estate. You can calculate CPOR with the following formula:
Total costs incurred by the rooms department ÷ total number of rooms sold = CPOR
Measuring CPOR allows you to:
- Identify efficiencies (or inefficiencies) in room sales
- Keep a check on cost variances over time
- Prevent expenses beyond a specific threshold for low occupancy rooms

Which F&B KPIs should you monitor?
6. RevPASH
RevPASH, or Revenue Per Available Seat Hour, is the F&B equivalent of RevPar. It indicates the utilization and revenue generation every hour per available seat in a hotel’s various F&B outlets. The formula for RevPASH is as follows:
Total outlet revenue ÷ (total number of seats x opening hours) = RevPASH
You can replace the hour in RevPASH with other timelines such as a day, a month, or a year to study longer-term trends.
RevPASH also helps you a number of benefits, including:
- Smarter labor scheduling to meet peak demand hours
- Procurement planning that are more aligned with revenue patterns
- Marketing intervention to plug low RevPASH hours
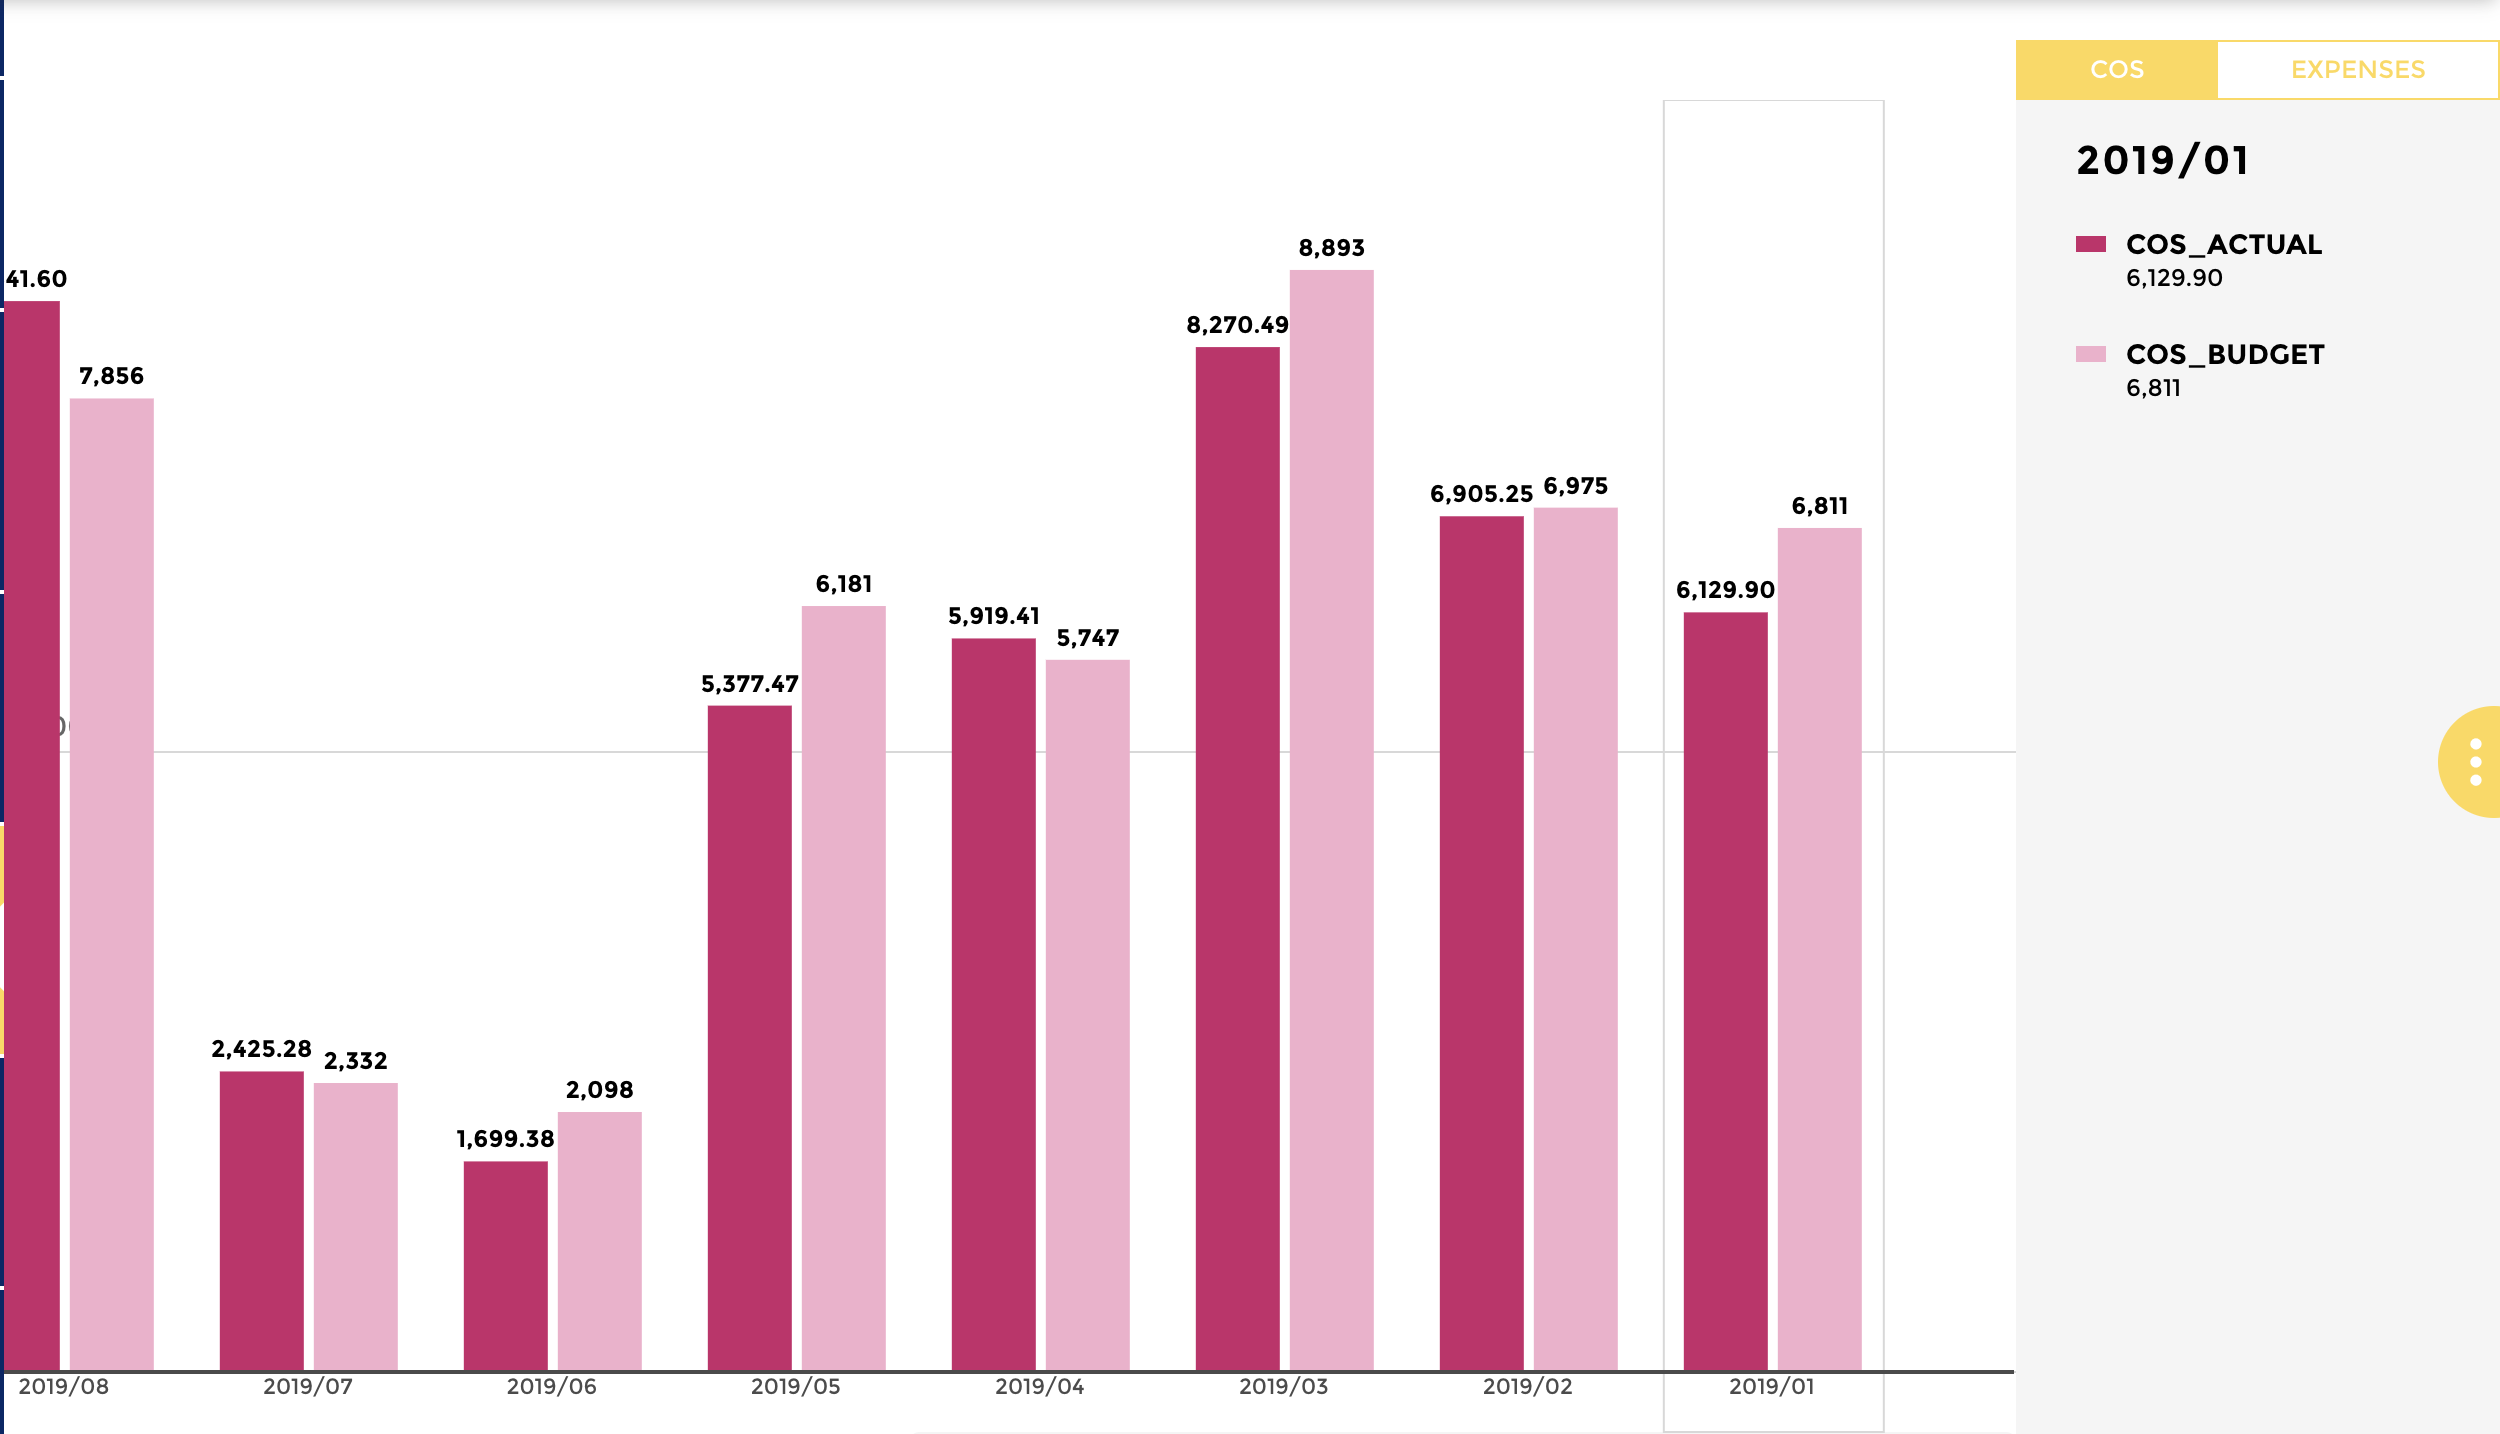
7. Cost of goods sold
Costs of goods sold (COGS), also known as operating costs or operating expenses (opex), encapsulates everything that you spend on to keep an F&B outlet up and running. COGS includes both fixed and variable costs – like the cost of renting furniture, which is fixed, or power bills, which are variable.
In some cases, the cost of goods sold is considered to be the pure-play cost of procuring materials and tangibles in order to drive F&B product sales.
You can calculate COGS as a percentage using this formula:
((Beginning inventory ÷ purchases) – ending inventory) ÷ total sales = COGS
This will tell you exactly how many pence are going into every pound of sales that an F&B outlet earns. Its benefits are as follows:
- Points out any inefficiencies or bottlenecks in the procurement chain
- Suggests where you need to speed up inventory movement
- Predicts possible waste if COGS is too high, meaning inventory isn’t fully utilized

8. Menu item profit and popularity
This is perhaps the most important metric for mid-to-long-term F&B decisions. An analysis of profitability and popularity by product will tell you which elements of your F&B fare are working (and which are not).
The formulas for these two KPIs are:
Listed/menu price of a product – product COGS = menu item profitability
AND
(100% ÷ number of products in the menu category) – ((specific product sales ÷ total sales in menu category) x 100) = menu item popularity
In the latter formula, the lower the metric, the more popular the product.
Let’s say, for example, that there are five products in a menu category (e.g., appetizers) – so the average or expected popularity of each product would be 100% ÷ 5 = 20%.
Now, imagine appetizer #1 makes up 22% of total appetizer sales.
20%-22%=-2, making appetizer no.1 extremely popular. The lower the metric is in value, the more popular the product!
These KPIs are helpful for better menu engineering, enabling you to:
- Eliminate unpopular (or unprofitable) products
- Anticipate hiring needs to re-envision menu strategy
- Plan seasonal menu rotations to better address consumer needs and outperform your competition
9. Food and beverage sales per guest and per period
The sales per guest/per period KPI indicates how efficiently inventory is moving on a daily basis.
While profit margins aren’t considered in this formula, average sales across guests or time periods by sheer volumes is a good measure of operational efficiency.
You can calculate this KPI using a simple formula:
Total F&B sales ÷ total occupied seats per day/month/year = F&B sales per guest per period
The benefits of monitor this metric are plenty:
- Reducing investment in highly perishable raw material in non-peak periods
- Creating bundled offers and promotions to boost sales per customer/seat
- Planning bulk F&B events like buffets based on estimated sales per guest
10. Food wasted per food purchased
Food waste is a massive problem, not just from a cost standpoint, but also for a hotel’s carbon footprint.
You can calculate total food wasted per food purchase by using the following formula:
(Total food wasted ÷ beginning inventory) x 100 = food wasted per food purchase
It is useful to further break down this KPI into sub-categories such as waste during food preparation, spoilage, and waste from customer plates. The benefits of this KPI include:
- Insights into an F&B outlet’s carbon footprint and sustainability
- Inefficiencies highlighted, such as easily perishable raw materials that are low on profitability
- Marketing, promotions, and non-profit initiatives to reduce waste
Ultimately, the right data can help the hospitality sector to optimize operations, lower costs, and drive revenues. This is particularly important in the modern context, as it is a period of revenue recovery for the global hospitality sector.
So, as you enter a promising rebound, avoid casting your net too far or too wide.
Zero-in on the specific performance metrics we discussed in this article to make life simpler for your operations managers and your chances of business success stronger than ever before.


