Nous traitons des données tous les jours au travail. Que ce soit pour comprendre des données de performance sur le trafic d’un site web, des performances commerciales ou la gestion des employés, chacun de nous tente d’en extraire de l’information. Mais il est difficile de choisir le bon graphique pour la bonne donnée, celui qui permettra d’illustrer au mieux nos indicateurs.
Qu’est-ce qu’un bon reporting ?
Définition du reporting
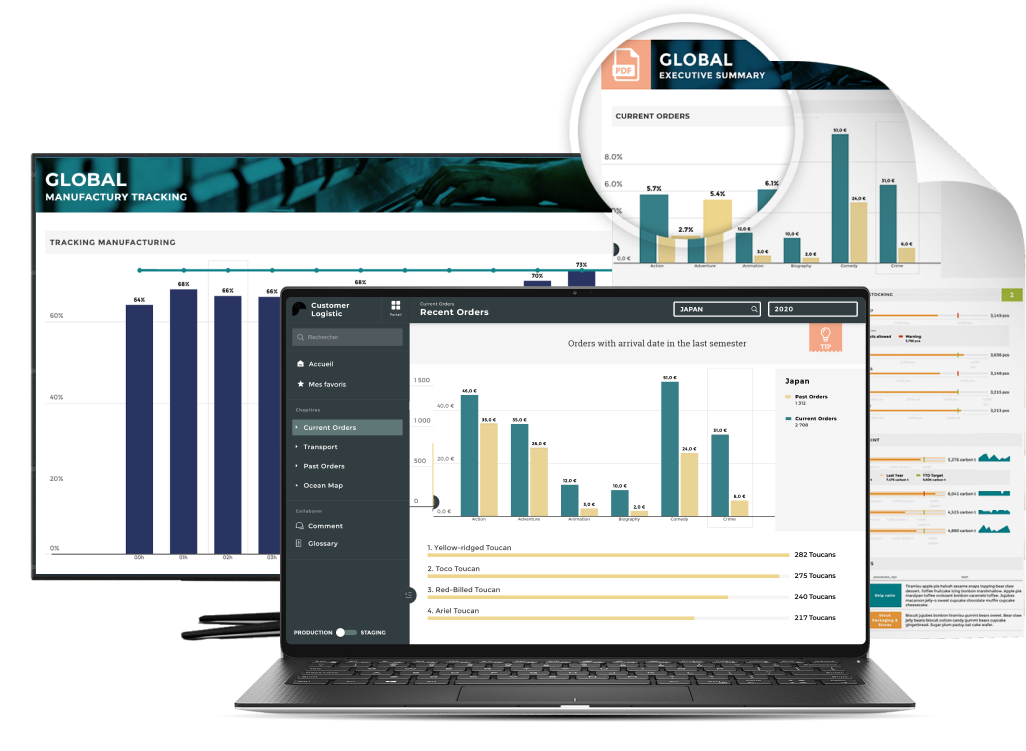
Le terme « Reporting » désigne une famille d’outils de Business Intelligence destinés à assurer la réalisation, la publication et la diffusion de rapports d’activité selon un format prédéterminé.
Avec l'augmentation massive des données collectées au cours de la dernière décennie, l'enjeu aujourd'hui est de les utiliser efficacement. Le reporting est souvent inexistant ou embryonnaire dans de nombreuses organisations, car les outils de Business Intelligence étaient traditionnellement destinés aux experts en traitement de données.
Importance du reporting
Savoir bien représenter des informations, c’est offrir la possibilité à son équipe de comprendre des sujets complexes en un coup d’œil. Que ce soit pour piloter la performance, communiquer ou présenter des résultats, une bonne visualisation de données démocratise l’accès à l’information pour tous les membres d’une organisation.
Peu importe l’outil de data visualisation utilisé, l’important est de choisir le bon type de graphique pour représenter vos données et leur donner du sens.
Comment construire un bon reporting ?
Un bon reporting, c’est tout d’abord un graphique adapté à vos informations pour visualiser clairement les données.
Un mauvais choix et toutes vos données peuvent faire l’objet d’erreurs d’interprétation, ou même de confusion pour votre audience. Voici 5 étapes pour construire un bon reporting et mieux visualiser vos données.
Étape 1 : Hiérarchiser les indicateurs
Votre reporting doit être clair et concis. Trop souvent, le manque de définition des besoins pousse à créer des graphiques trop complexes.
Définissez votre audience, ses besoins et sélectionnez les indicateurs les plus importants. Évitez l'exhaustivité qui peut rendre le reporting illisible et préférez la création d’un nouveau reporting pour toutes les idées qui sortent du périmètre que vous avez fixé.
Étape 2 : Schématiser et tester les graphiques
Avant de vous lancer dans la création détaillée, faites des schémas sur papier. Échangez avec votre audience pour définir les améliorations nécessaires et valider l'utilité des graphiques.
Répétez cette étape jusqu’à ce que votre reporting soit pertinent. Rappelez-vous que pour réaliser un bon tableau de bord, une règle prime : un graphique = un message.
Étape 3 : Intégrer les données
Intégrez vos volumes de données dans les graphiques définis. Soyez prêt à ajuster en fonction des retours de vos collaborateurs.
Étape 4 : Raconter une histoire
Chaque graphique doit transmettre un message clair. C’est ce qu’on appelle le data storytelling ou la capacité à raconter une histoire avec des données afin d’en simplifier la compréhension.
Utilisez des commentaires, des légendes et des couleurs adaptées pour contextualiser vos données. Offrez toutes les chances à vos interlocuteurs de bien comprendre les informations que vous leur partagez.
Étape 5 : Un bon reporting est actionnable
Le but ultime de votre reporting est de permettre de prendre des actions basées sur les données.
Imaginons que le département commercial n’a pas atteint ses objectifs. Comment l’aider ? Quelles étaient les performances à n-1 ? Est-ce un problème de saisonnalité ou de sous-performance dû à l’absence d’un des commerciaux ? Recoupez les données et offrez des points d’action précis.
Quels sont les meilleurs graphiques pour représenter vos données ?
Analyser des relations entre plusieurs données
Bubble Chart
Objectif : Illustrer des corrélations en mettant en relation trois indicateurs. Idéal pour comparer des ensembles complexes.
Application : Les graphiques à bulles (bubble charts) sont parfaits pour comparer et montrer les relations entre des labels et des catégories, en utilisant le positionnement et les proportions des bulles. Ces graphiques peuvent analyser des modèles et des corrélations, mais leur capacité est limitée en termes de volume de données. Pour surmonter cette limitation, on peut ajouter de l’interactivité, permettant de révéler des informations supplémentaires en cliquant sur les bulles.
Exemple : Comparer les relations entre les différentes maisons de Game of Thrones. En cliquant sur les bulles, on peut découvrir des informations précises sur les actions des différents protagonistes.

Force-directed graph
Objectif : Idéal pour analyser des réseaux ou des liens entre plusieurs entités.
Application : Permet d’identifier des liens entre canaux, en termes de volume ou de flux, et permet des comparaisons deux à deux.
Bar and line chart
Objectif : Corréler un volume et une variation.
Application : La superposition d’un graphique à barres (bar chart) et d’un graphique en courbes (line chart) est idéale pour montrer à la fois un volume et une variation.
Le graphique en courbes révèle les tendances ou le progrès au fil du temps et peut être utilisé pour montrer différentes catégories de données, en exposant un ensemble de données continues.
Ce type de graphique est particulièrement pertinent lorsque vous souhaitez comparer deux métriques ayant des échelles de valeur très différentes, comme 3% et 3 000 k€.
Exemple : Évaluer votre consommation énergétique à travers le temps et observer son évolution.

Scorecard
Objectif : Illustrer des dizaines d’indicateurs qui n’ont pas, ou peu, de rapports directs entre eux.
Application : En théorie, ce graphique est utilisé en dernier recours. Pour les puristes de la data visualisation, il n’apporte pas de véritable valeur en termes de lecture. Utilisez ce graphique pour présenter des données de différentes valeurs et unités.
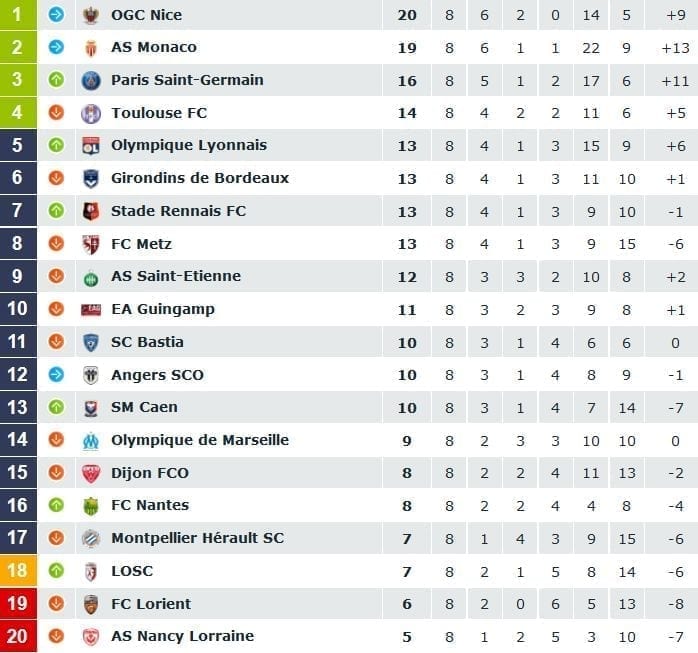
Exemple : Le classement hebdomadaire de la Ligue 1 est un exemple connu de scorecard. Il présente un label pour chaque équipe et plusieurs KPI, tels que les points obtenus, les matchs gagnés, les buts marqués, etc.
Comparer des données
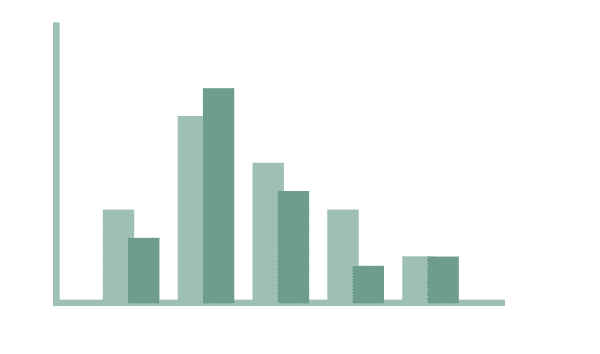
Barchart
Objectif : Comparer des volumes ou des flux, avec une dimension qui peut aussi être temporelle.
Application : Utilisez plusieurs indicateurs dans un même groupe pour comparer vos données. Restez simple et ne comparez pas plus de trois indicateurs à la fois.
Lien de l’exemple de Bar Chart interactif
Horizontal Barchart
Objectif : Comparer des entités entre elles, comme la performance d’une entreprise par rapport à son concurrent.
Application : Un histogramme horizontal peut être utilisé lorsqu’il y a plus de 10 labels à comparer. Ce type de graphique permet de comparer jusqu’à trois types de données différentes.
Exemple de chart horizontal très parlant

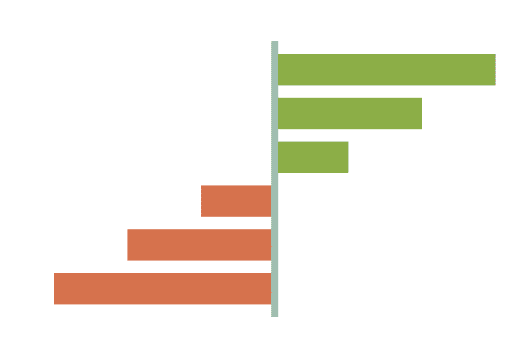
Centered average leaderboard
Objectif : Comparer des indicateurs en volume ou des flux par entité en utilisant une moyenne.
Application : Utilisez une moyenne de référence pour représenter des données de performance. Comparez la performance de plusieurs entités ou individus par rapport à un objectif.
Ce type de graphique est souvent utilisé pour étudier des répartitions telles que le genre, l'âge, ou la catégorie socio-professionnelle.
Notre cocotte l’illustre bien dans cet exemple
Slopegraph
Objectif : Montrer la tendance d’une variation entre deux dates t et t+1 pour chaque entité.
Application : Analyser l’évolution entre deux situations. Plus les barres sont entremêlées, plus le classement de départ a été bouleversé.
Ce type de visualisation est idéal pour comparer de nombreuses variables et voir les relations entre elles.
Exemple : Comparer la performance de différents produits sur deux années.
Dans l’exemple interactif de Toucan Cocotte, on étudie l’évolution du pourcentage des femmes jouant aux jeux vidéo sur 4 ans.

Bullet Chart
Objectif : Comparer des performances à des objectifs.
Application : Utilisez la barre jaune pour l’objectif et la barre horizontale pour les performances en cours.
Ce graphique montre la progression d’un indicateur vers un but, permettant de comparer cette mesure à une autre en fournissant un contexte en termes de taux ou de performance.
Exemple : Comparer le nombre de dates Tinder accumulées sur un mois par rapport au nombre attendu.

Heatmap
Objectif : Obtenir une vue globale sur la combinaison de plusieurs indicateurs et entités. Idéal pour recouper des données transverses.
Application : Une heatmap visualise les données grâce à des variations de coloration, utile pour croiser des données variées en plaçant les variables dans les lignes et les colonnes et en colorant les cellules. Elle permet de révéler des modèles et de détecter des corrélations entre les variables.
Lien interactif de l’exemple

Cartographie
Objectif : Visualiser des indicateurs géographiquement.
Application : Parfait pour représenter des données de géolocalisation combinées à des données de performance.
La cartographie permet d’afficher des zones géographiques divisées, des régions colorées ou des plans de centres commerciaux en fonction d’une variable de données.
Cela permet de visualiser des valeurs sur une zone géographique et d'afficher des variations ou des tendances.
Exemple : Cartographie des artistes préférés par état aux USA, montrant la popularité de Jay-Z, Drake et les Daft Punk.

Visualiser des données temporelles
Linechart
Objectif : Montrer l’évolution de données temporelles.
Application : Les graphiques linéaires affichent une valeur quantitative sur un intervalle ou une durée continue, montrant des tendances et des relations dans le temps. Ils aident également à fournir une vision globale sur un intervalle donné pour traduire l’évolution des données au cours de cette période.
Limitez à trois lignes pour garder une lecture facile.
Exemple : L’évolution de la présence des femmes dans différents métiers depuis 1983, montrant une baisse constante dans l’IT.

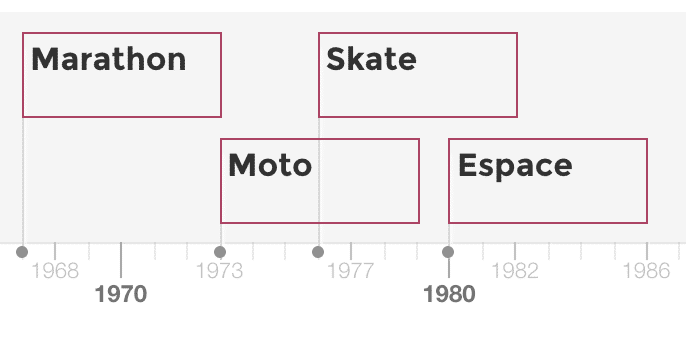
Timeline
Objectif : Représenter des événements ou des faits marquants pour une organisation ou un individu.
Application : Représenter graphiquement la biographie d’un individu ou l’histoire d’une organisation. Sélectionnez les données les plus importantes pour garder une visualisation claire et simple.
Stacked Barchart
Objectif : Découper le volume total d’une entité en plusieurs catégories.
Application : Ce graphique est utilisé pour comparer les catégories d’une entité entre elles, mettant en évidence les points forts et faibles de chaque sous-ensemble et leur impact sur l’activité d’un département, par exemple.

Waterfall
Objectif : Communément appelé le Mario Chart à cause des briques en suspension, le Waterfall permet d’illustrer des flux.
Application : Le Waterfall permet de comprendre le cumul de valeurs positives et négatives sur une période donnée.
Il est utilisé pour montrer comment une valeur initiale est affectée par des valeurs intermédiaires, positives ou négatives, et aboutit à une valeur finale.
Exemple : Il permet de mieux comprendre l’impact de différents éléments sur un résultat global, comme l'impact des différents magasins sur la recette globale d’une entreprise.

Treemap
Objectif : Visualiser des hiérarchies ou des structures complexes.
Application : La Treemap est un moyen compact et efficace de visualiser un vaste répertoire de données et de variables sans occuper trop d’espace. Elle donne un aperçu rapide d’une structure et permet une comparaison pertinente entre différentes entités.

Verbatims
Objectif : Illustrer vos performances par des verbatims clients et explorer des données en format texte.
Application : Présenter des commentaires par catégorie et une représentation graphique de leur répartition.

Data storytelling : raconter une histoire grâce au reporting
Contextualiser
Un bon reporting de visualisation de données n’est rien sans contexte. Pour rendre vos données compréhensibles et utiles, ajoutez des commentaires, des sources, des unités, des légendes et des glossaires. Cela permet à vos lecteurs de comprendre rapidement et facilement les informations présentées.
Enrichir le contenu
Une image vaut mille mots. Enrichissez vos tableaux de bord avec du contenu vidéo ou des images pour accompagner et contextualiser l’information que vous partagez avec votre audience ou votre équipe. Par exemple, l’illustration d’un graphique en cascade avec une image de Mario aide à comprendre la structure du Waterfall.
Valoriser les informations importantes
Une visualisation de données réussie met en valeur les éléments essentiels à retenir. Elle raconte une histoire et facilite la transmission de l’information grâce à des éléments visuels tels que les couleurs et le contexte. Valoriser les informations importantes permet de les rendre actionnables et opérationnelles.
Construire un bon reporting
Construire un bon reporting ne consiste pas à condenser le maximum d’informations techniques dans un support le plus court possible. Il s’agit plutôt de rendre ces informations compréhensibles au plus grand nombre. Sélectionnez les informations les plus pertinentes et mettez-vous à la place de vos lecteurs. Un tableau de bord efficace doit pouvoir être compris sans explications supplémentaires. Si votre équipe peut comprendre le tableau de bord dès sa réception, vous avez réussi votre exercice de reporting.


