Definition: Fleet Management
This term refers to the management of a fleet of vehicles that are rented or purchased by a company and used daily by their collaborators.
A fleet manager is often charged with the task of organizing these fleets. Fleet managers have various different roles – they must ensure the safety and comfort of the vehicle users, as well as make sure the company’s needs are met and the budget is respected. Companies are often looking to reduce costs related to their vehicle fleets.
It’s essential to take various different factors into account, including maintenance, fuel, vehicle use (whether private or not), vehicle selection, follow-up with drivers, etc.
This means that fleet managers need to keep track of a large quantity of data and be able to manage a variety of different tasks, and must also prepare regular reports for their company, providing key information on their vehicle fleet. This is why having a customized dashboard is invaluable.
An overview of fleet management tasks
Large companies will often try to outsource and automate the management of their vehicle fleet as much as possible. One solution is to work with a fleet manager, who will act as a link between the company and other collaborators (suppliers, service providers, users, etc.) Other tasks include addressing any administrative and accounting constraints linked to the use of the fleet.
However, there are simpler alternatives to delegating all of these tasks to a fleet manager.
Reporting is an ideal way to centralize all of the data necessary to simplify and optimize the management of a company’s vehicle fleets.
A variety of different types of data are needed for fleet management. It’s important to take into account :
- geolocation of vehicles
- technical diagnostics
- use of data by various different professionals in a company
- driver management
- vehicle and driver safety
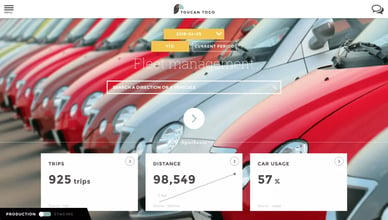
An example of a fleet management dashboard :
The home page provides an overview of the vehicle fleet’s activity, including the number of trips, the distance traveled and the percentage of available vehicles that are used.
We can also see which vehicles have traveled the farthest and have used the most fuel, as well as information on maintenance.
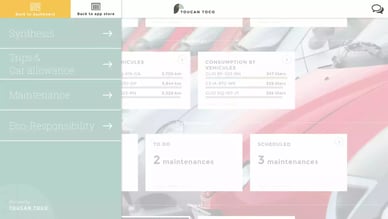
The application includes four tabs: synthesis, trips & car allowance, maintenance and eco-responsibility.
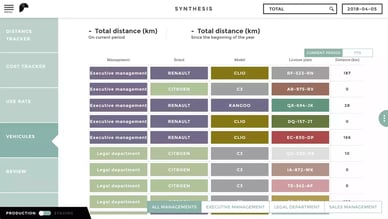
Synthesis
In the first tab, you can see information on distances, costs, usage rates, and vehicles, as well as a review that includes several of these criteria.
Vehicles are organized by various different indicators: which departments are using them, the vehicle’s brand and model, license plates and distance traveled.
All departments are displayed, in order to compare vehicle use data, but it is also possible to see only data related to one specific department (using the buttons on the bottom-right of the screen). This section shows both long-term and short-term data on vehicle use.
Review
This section compares various different types of data: total fuel consumption of vehicles and the number of trips and kilometers traveled, once again categorized by department.
Trips and Car Allowance
This section has two parts. The “car allowance” tab shows exactly how many kilometers have been traveled per vehicle, facilitating the calculation of car allowances.
The “trips” selection shows information on different types of vehicle use: we can compare the amount of private and professional trips taken by the user since the beginning of the year.
Maintenance
This tab offers information on maintenance, divided into three categories. Maintenance that has not been completed despite a reminder, maintenance to be scheduled, and maintenance that has already been scheduled.
With Toucan Toco, users also benefit from a notification system integrated directly into the application! Both the user and the company are alerted that maintenance needs to be done.
Eco-Responsibility
The last section shows information on estimated fuel consumption and average fuel consumption, on two different screens. The “estimated consumption rate” tab enables the user to track short-term and long-term consumption rates, compared to a set goal. Here we see that on March 4, the estimated fuel consumption was 3 257 liters. The actual amount of fuel used was 3.022 liters.
In the “average consumption” tab, we can see the average fuel consumption rates per 100km and per trip (categorized by department), as well as the total average, taking into account the different data categories.
Key points
This dashboard offers various clear benefits :
- budget is managed effectively
- decisions can be made quickly
- data is centralized and available to all collaborators within the company, whatever their level of technical expertise
- fleet management is optimized and simplified, allowing data to be tracked in the short and long-term
This makes fleet management more efficient – data is accessible anywhere, by anyone, on any device, even offline. This allows collaborators to make decisions immediately, in any context.