On the one hand, we have Data analysts who want to explore data while novice beginners want quick access to data.
To meet the needs of the latter, we created the concept of Data Storytelling’ which is quite different from Data Exploration.
So let’s clear up some misconceptions between the two.
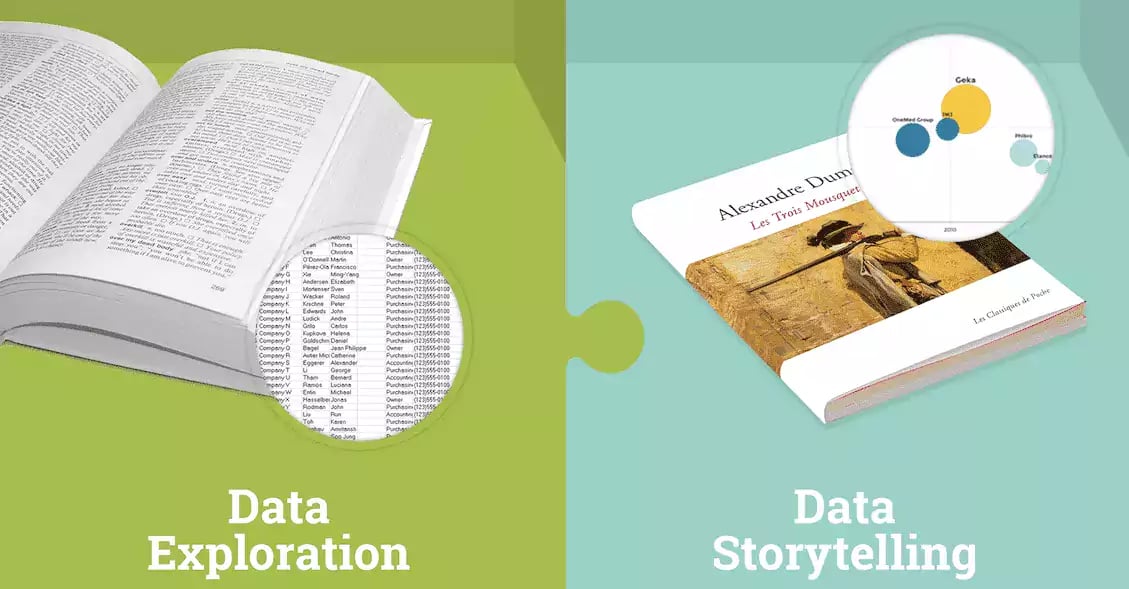
.webp?width=700&name=Capture-d%E2%80%99e%CC%81cran-2017-05-03-a%CC%80-17.03.48%20(1).webp)
These two photos show the remarkable distinction between Data Storytelling and Exploration.
#1 DATA EXPLORATION IS FOR DATA ANALYSTS
The analyst is the expert and knows how to use a unique tool. This analyst might use the same tool intensely for many days in a row. He explores the database thoroughly before communicating it to another person.
Excel can be used for data exploration
Other Business Intelligence tools such as Business Object, IBM Cognos, Oracle BI, or even PowerBI, Qlik and Tableau Software can also be used for data exploration. These software tools are used to explore the database to answer complex questions.
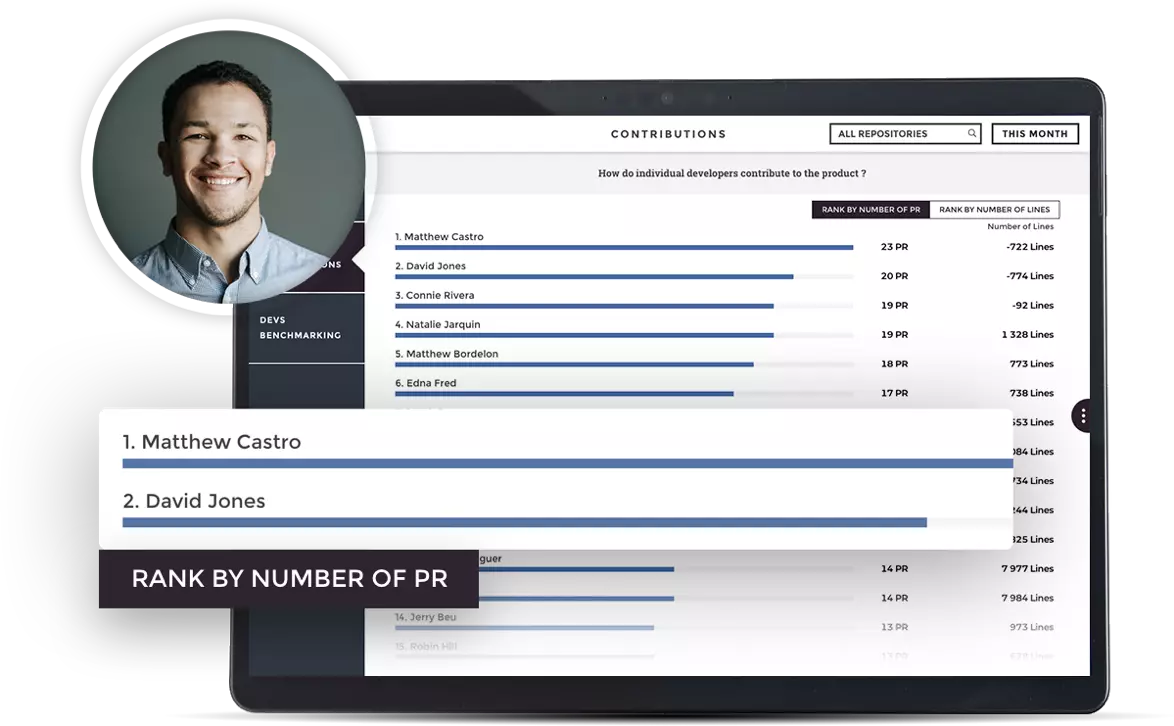
Here is an example of data exploration
For example, let’s say that you want to know how many women, between the ages of 25 and 35, who belong to the same fidelity program, have purchased an item from the meat section as well as a chocolate bar that was on sale in the last 23 days.
This is clearly an analyst’s job.
#2 DATA STORYTELLING IS FOR THE NOVICE BEGINNER
Data storytelling lets a beginner easily use a tool and then apply it to a situation.
A non-technical business decision-maker might only use this tool a few minutes every week, but must be able to use this tool instantly without help from an expert. And that’s not only revolutionary, but it puts also the data in your team’s hands.
The data is accessed instantly and the information can be easily used for buying, selling, managing, marketing or directing. This type of user is more likely to be a salesman, a Human Resource Manager, someone in Finance or Marketing or even a company Manager.
This is what Toucan is dedicated to accomplishing. Our main goal is to help users who are unfamiliar with data analysis to make better decisions based on their databases, thanks to Dataviz, yeah!!
Then, Mobile Applications allow also easy access to the company’s main information in just a few clicks.
An example of data storytelling
Let’s say you want to know the exact sales revenue per day, per month, per year, for a certain department, as well as a comparison with the same results for the previous year. This data query is clear and hierarchical.
Data Storytelling is The way to go here.
#3 TAKING CARE OF OUR CLIENTS
Comparing Data Exploration to Data Storytelling is like comparing ‘The Collins Dictionary’ to an award-winning piece of literature, or like comparing IMDB’s database to The Game of Throne’s last season; or comparing a 19th-century pictorial art dictionary to a temporary exposition at an Art Museum.
Would you rather take a dictionary or a novel to read the next time you went on vacation? You have already the answer, right?
Even though every word in your book is in that dictionary, the information presented in the novel is destined for a reader, whereas, the dictionary is set up so that a specialist can find exactly what he is looking for.
Here at Toucan, our team members and 130 clients with over 4 million customer-facing analytics instances believe in Data Storytelling. What about you?