Retail Data Analytics: Why Catching the Train Now is Crucial

Clement
Publié le 12.06.19
Mis à jour le 13.01.26
5 min
Résumer cet article avec :
The volume and value of data in the retail industry are increasing exponentially each year. In this article, Toucan Toco experts explain how to transform retail data analytics into easily available information.
![]()
Data is the new currency of the retail sector's digital economy. The crucial role that retail data analytics play in improving the economic performance of this industry is well established.
According to a study by Snowflake and Harvard Business Review (2018) companies that make data-driven decisions have the best chance for longevity. Yet across industries, they found that only 5% of retail and consumer packaged goods (CPG) companies are data-driven.
Why is it hard for retailers to be data-driven?
Compared to pure players, Brick & Mortar companies have often struggled to consolidate their data and make it actionable, while online retail companies have somewhat easily implemented retail data solutions.
Information provided by consumers during online purchases, for example, is helpful in:
- Enabling online retailers to better understand consumption habits
- Optimizing their processes
- Driving long-term, sustainable success
They're able to access, through the collection of consumer data, insights around gender and brand preferences, consumer budgets, purchase patterns, and so much more.
The customer experience is also improved because data-driven retailers are equipped to customize a truly personalized experience for online shoppers.
The main difficulty for retailers is that data isn't necessarily accessible, sometimes due to the fact that it's scattered across disparate systems, websites, and/or store locations. The data may seem difficult to collect if management doesn't prioritize a data culture, put intelligent systems in place, or adopt the right tools.
In the context of data skepticism, it's been difficult to establish a true data culture...

Upper-level management at many retail companies has resisted establishing data-driven cultures. A study by the Fortune Knowledge Group even stated that executives of large companies trust their instincts more than data when decisions become complex.
“In the age of Big Data, it is often assumed that the rational and analytical are the primary drivers of business decision making. However, the more complex decisions become, the more top executives are looking at emotional factors as their key catalysts.”
It may be obvious that these situations can prove problematic.
Indeed, when managers and executives are reluctant to democratize access to retail data analytics, very few employees have access to helpful information. As a result, data reports do not “go down” to the store level. This lack of information is reported by shop managers and sales assistants, and often affects crucial elements beyond the insights themselves, such as the fact that employees are less motivated when they don't know what's going on or when they don't have clear, data-driven goals that they can work towards.
So why this hesitation? Well, for starters, there is a common misconception that providing access to data for all the decision-makers at a company is a security risk.
While the concern is valid, democratizing access to data does not mean opening it up entirely!
Would you rather have a PowerPoint or Excel file that anyone can share with anyone, or have software with advanced user restrictions and the ability to track who uses it and where?
We think the answer is simple.
Rather than restricting access, some companies have therefore opted for another principle: tokenization. This approach allows sensitive data to be replaced by other similar values that refer to it. Thanks to these methods, calculation systems make it possible not to make certain values visible.
THE DIFFICULTY OF SETTING UP DATA-DRIVEN CULTURES IN RETAIL IS TECHNOLOGICAL AND ORGANIZATIONAL
Reports in the hands of store managers are difficult to use
Store managers are often confronted with retail data reports or retail KPIs that, in isolation, are difficult to read and analyze. These reports lead them to spend more time processing or analyzing data than actually focusing on the business, and ultimately provide less value than they take away.
In addition, the methods used to collect the data at many retail organizations cause delays. Reports can take as much as several weeks to complete and are no longer relevant by the time they are finally delivered to the people that need them.
To be used effectively, a software solution must be able to answer key questions in a pragmatic way.
Simply put: retail analytics software should make life easier, for everyone! That means for employees at the store level, as well as upper-level management. Leading these initiatives is an important step in rocking any successful data project.
An ultimate goal for companies is to provide every employee with data that is simple and easily accessible. It is, therefore, necessary to offer an easy-to-use tool that allows you to change the angle of view of the data according to your needs.
 Example: Imagine a platform where a store manager finds all information relevant to his or her location in one place. This platform is:
- Easily accessible
- Easily understandable
- Easily shared
In it, they would ideally find a tutorial running through the most updated layout of products in a store, the training plan(s) for their team, the schedule of the upcoming week, the performance of sales at the employee and product levels…the list goes on.
The cultural gap between specific departments
Gartner specifies that a fundamental characteristic of a (successful) data culture is the provision of data in a simple and clear manner, understandable by business users at every level. Amongst the most important things to note here is that this culture must be applied broadly and not focused on a single business line, location, or department (as is often the case).
Without digital tools that allow this information to be shared, it is not easy to align the company’s strategy and the data that is used. Each department must be able to put the compare results with the others.
For example, the implementation of one of our customers’ phygital strategy consisted of sharing information collected online and at points of sale via their in-store Wi-Fi portal. This made it possible to generate a global vision of consumer behavior, shared by all their departments via a common dashboard.
How Do you deliver actionable retail data analytics for all operational stakeholders?
Many data projects are designed and implemented with no clear or precise business use, making data something that's actually detrimental to business output.
Simply obtaining data and making it available isn't the ultimate goal. Let’s take a look at how the same data can tell different stories by examining different business use-cases.
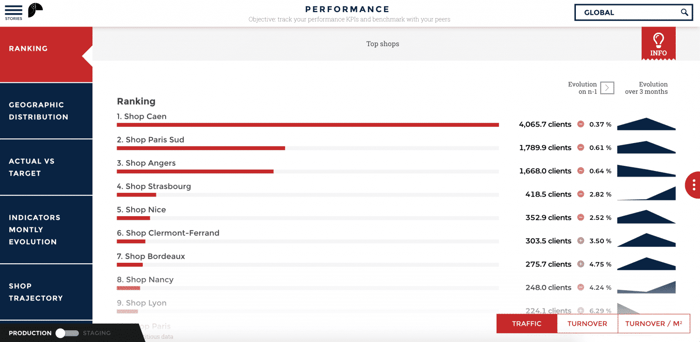
We'll use the store manager who needs to manage his portfolio at a glance as an example.
Retail managers must assume a certain number of responsibilities to generate optimized reports. They must be attentive to their portfolio performance and make economic and administrative management decisions over many locations.
They are, as a result, often overwhelmed by the sheer volume of data that they need to manage. While they may have access to retail data analytics (sales performance, customer profiles, etc.), they often lack the tools to transform that information into something actionable. With data storytelling solutions, however, these same managers can easily manage:
- Their data
- Their teams' performance
- Multiple levels: within stores, within their network, etc.
They can provide common reports for information relevant to a large number of stores and at different levels of management. This allows distribution managers to manage resources and inventory through a universally applicable tool that instills a data culture and data-driven vision for their subordinates and executives alike.
Store managers: get easy access to valuable information (that actually matters)
Store managers need access to certain key and valuable retail data analytics to ensure sales performance. However, this information can be a hassle to collect or is poorly communicated.
Thanks to data storytelling solutions, these same people can access the data produced by the top management at a glance. They can understand, in real-time, expected turnover, current promotions, how to strategically position products in their stores, optimal store hours, etc.… In the opposite direction, shop managers can easily communicate relevant data points to upper-level management.
Marketing: a common application for better communication
![]()
In the retail industry, the marketing department needs to know, in real-time, the ROI generated by their actions:
- How many sales were generated after a specific promotion?
- Did that promotion increase store or online visits?
- Did consumers respond positively to in-store or online events?
- Did new products perform better thanks to specific communications?
To answer these questions, marketing teams often have difficulty directly contacting shop staff. Fragmented teams are no new phenomenon!
The use of a common retail analytics application solves this and more. Information can be aggregated, distributed, and leveraged in minutes. Marketing teams can cross-reference their campaign data with in-store sales data and objectively demonstrate the effectiveness (or lack thereof) of their operations.
How can data visualization help retailers embrace data transformation?
There are an infinite amount of factors that retailers must consider in today's tech-driven world. Declining sales, fierce competition, and rapidly changing consumer preferences make retail a difficult industry to thrive in. But all is not lost!
Despite the litany of challenges businesses are facing, data-driven retailers are able to show consistent growth by leveraging advanced retail analytics. Modern solutions designed and adapted for specific department issues (Marketing, HR, Financial Services, you name it) make management and process optimization a breeze. In fact, they're becoming a "must-have" as opposed to a "nice to have".

Clement
Clément is Head of Sales at Toucan, the leading embedded analytics platform designed to help SaaS companies deliver powerful, user-friendly data experiences. With a strong background in B2B sales and customer success, he helps organizations unlock the full value of their data by embedding intuitive dashboards directly into their products. On Toucan’s blog, Clément shares insights on how embedded analytics can drive customer engagement, boost retention, and create new revenue streams for SaaS businesses. His expertise lies in bridging the gap between business needs and data solutions to help companies scale smarter.
Voir tous les articles


