.png?width=512&height=358&name=Homepage_Hero_image_V2%20(1).png)
You are a dashboard builder who has rigorously worked to plan, create, and request feedback on your first design. You may feel very confident in your work, and you should. However, one crucial step remains before deploying your data visualization.
We hear multiple complaints from customers who made the shift from other solutions and are skeptical of transitioning to another. Here are some of the most common frustrations:
- A glitchy interface
- Difficulty accessing reports
- Visualizations not functioning properly
- generating different results for users working off of the same data sets
These are crucial weaknesses of many dashboard solutions, and after experiencing these inconveniences, it's easy to see why so many firms show reservations when considering other platforms.
What if we told you that a thorough execution of the next step in the dashboard-building process could alleviate all of these concerns?
The testing process ensures the robustness of your application. Nobody wants to work off of a glitch-filled, erroneous program. By performing tests within your data visualization solution, you can catch bugs and mistakes before deployment
Data Accuracy Testing
Data accuracy makes or breaks a dashboard. Without accurate readings and the all too common scenario of team members extracting inconsistent data insights, data visualization becomes a much less effective tool.
Data Validation
Data is the heart of a dashboard. To deploy a dashboard, the builders must be wholly confident that each feature yields the correct data and can stand the test of time. Here are some of the steps included in the data validation process:
- Ensure that all data is correctly retrieved at every level and properly displayed
- Check all conditional formatting rules for data sets where applied
- Verify the accuracy of all calculations and code at every level
- Simulate the addition of large data sets to be sure that your dashboard and visualizations can handle high amounts of values
Performance and Security Testing
A dashboard's performance is paramount to data visualization's promise of convenience. Testing your application's speed under stress can help diagnose any lag complaints after app deployment. Here are some tests to perform in this category:
- Test initial load time (goal of fewer than 10 seconds)
- Analyze rendering for actions such as filtering and others
- Stress test for different volumes of data sets
- Test security and permissions for users to ensure all data is fully confidential and usable by all members of the audience.
UI Testing
Graph and Chart Testing
Graphs and charts are crucial to any effective dashboard. By including these visualizations, you can provide your audience with more detail and context of past trends.
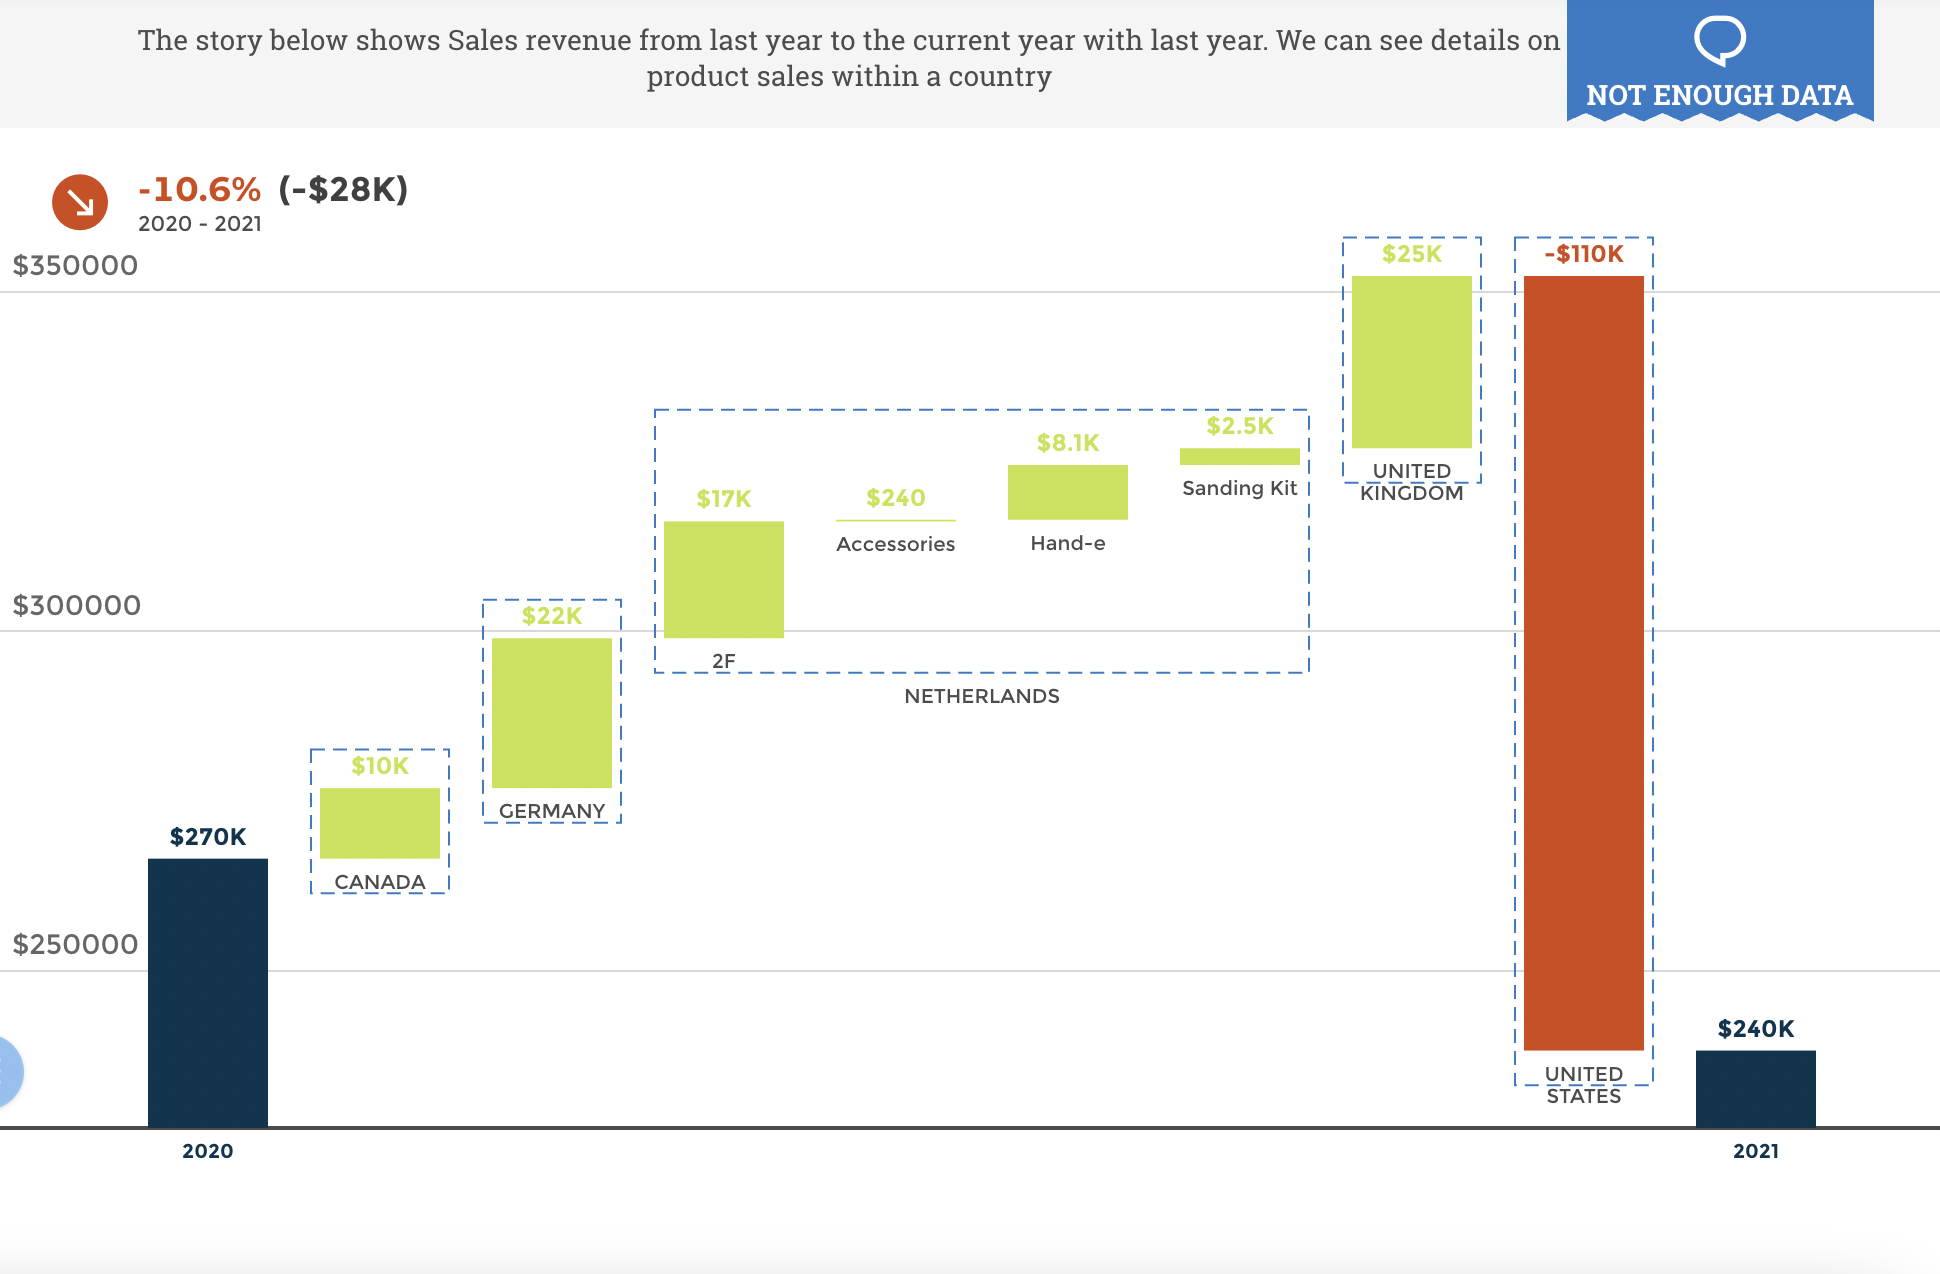
Because graphs hold such an important role in dashboards, they must be rigorously tested to ensure the accurate display of information. An absence of a design-focused testing process can lead to misinterpretations in data and wrongly-informed decision-making.

Here are some steps to follow when testing graphs and charts:
- Send an error message when data is missing in a graph.
- Test every possible data variation and how it affects a graph or chart. If these tests do not produce the desired outcomes, you know you have an error.
- Apply filters to test their functionality
- Use logical and dynamic plotting ranges.
- Check for font type and size consistency.
- Test functionality features such as scroll bars and legends (glossaries if available).
By performing these tests, you will be sure that your graph and charts read error-free when they are deployed.
Dashboard Testing
After performing a data accuracy check, it is important to test UI application functionality within your dashboard. With Toucan's "view as" feature, builders can preview app design within the dashboard builder, providing a reliable version of their application when deployed.
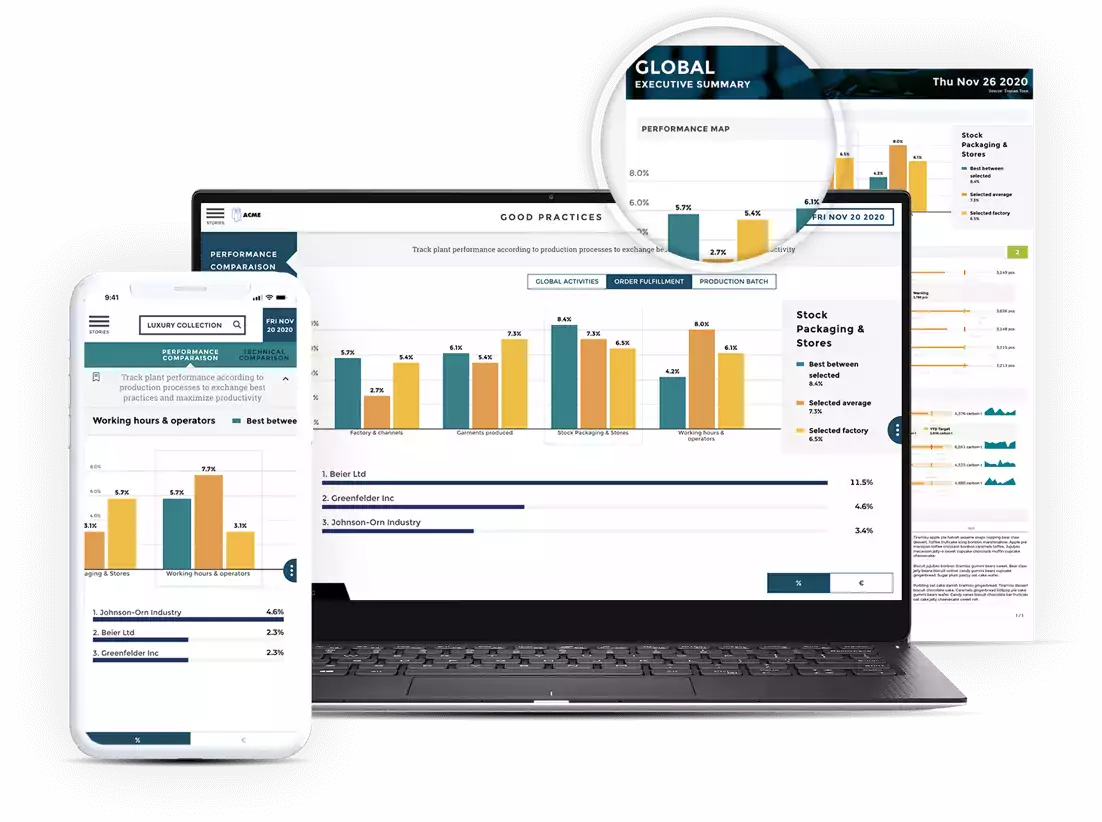
Another advantage of the "view as" is the inclusion of dashboard previews for every device, including traditional monitors, mobile devices, and even televisions. If builders dislike dashboard dimensions or other design features for a certain device in the preview, they can instantly note and perform the desired changes.
For solutions that do not support a similar function, the process is longer and more complex. Most importantly, dashboard testing also serves to ensure the accuracy of generated reports. The steps for dashboard design testing include:
- Cross-checking the dashboard titles against its generated report
- Verify all axes of charts and their labels
- Perform the prompt check
- Perform the drill-down report check
- Check for any browser compatibility issues
The Next Step
You prototyped your ideal dashboard(s) and tested them thoroughly to ensure the absence of bugs and errors. Congratulations!
Now, you will be deploying your dashboard to your end-users, who will enjoy the benefits of following this process accurately and thoroughly.


